
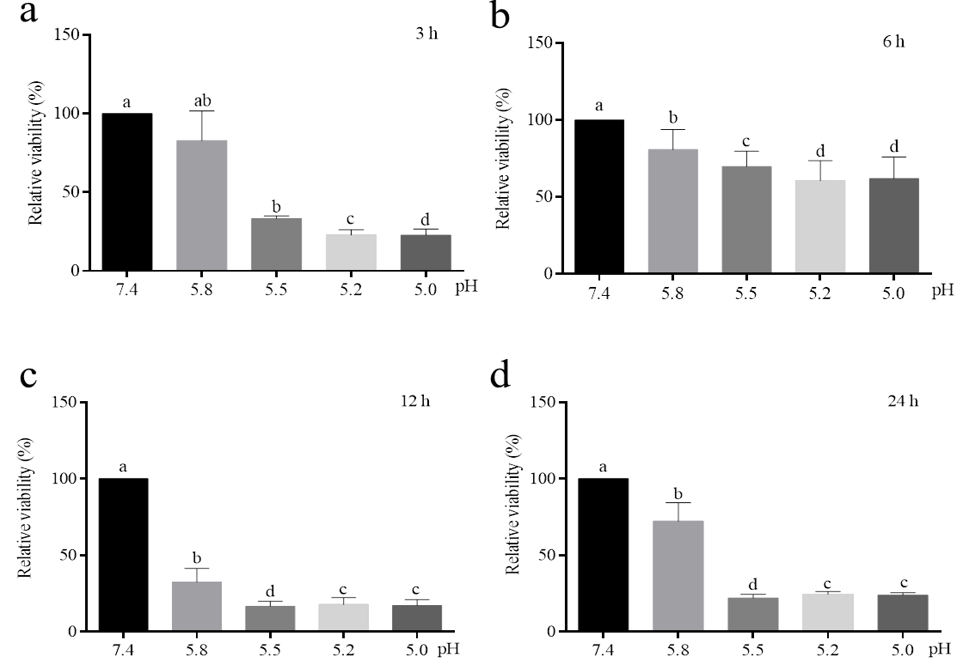
Fig. 1.
Effects of different solution pH and duration time on cell activity. Cells were treated with different solutions with pH of 7.4, 5.8, 5.6, 5.2 or 5.0 for 3, 6, 12 or 24 h. Relative cell viability was presented as a percentage relative to the control group. a,b,c Mean values within different letters were significantly different (P < 0.05).