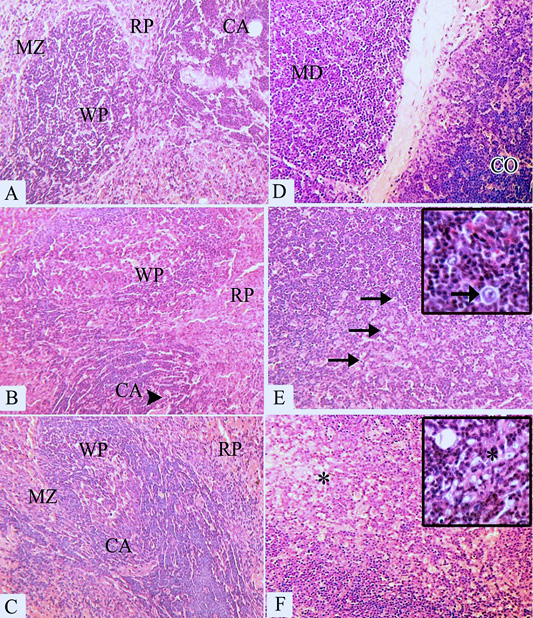
Histomorphology of (A) spleen (control group, WC) showed RP: Red pulp, WP: White pulp CA: Central artery, MZ: Marginal zone, (B) low dose of dietary soy (6.6%) phytoestrogens withdrawal group (WL) showing mild depletion of T cells in the PALS. The lymphocytes in the PALS have been replaced by small numbers of macrophages, granulocytes, and plasma cells, Brown fat was present (arrows). (C) high dose of dietary soy (26.41%) phytoestrogens withdrawal (WH) group. (D) thymus (control group) showing CO: Cortex, MD: Medulla. (E) thymus of low dose of dietary soy (6.6%) phytoestrogens withdrawal group (WL) showed apoptotic bodies (arrow). (F) thymus of high dose of dietary soy phytoestrogens withdrawal group (WH) showed striking tinctorial change is obvious in the treated thymus, especially in the cortical regions due to marked apoptosis of the lymphocytes in this region of the treated rat (astriks). [H&E stain; original magnification: ×20].
