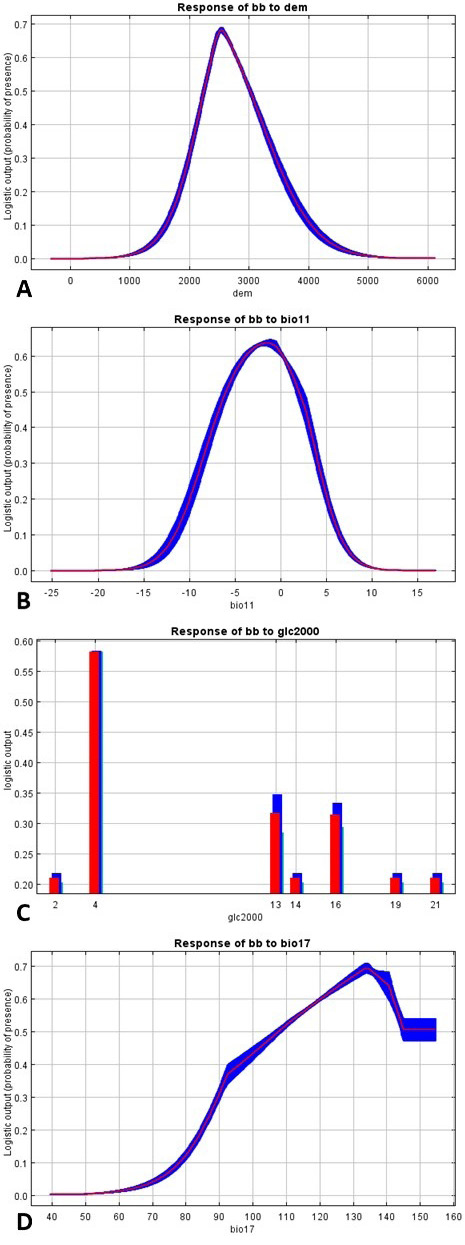
Fig. 6.
Response curves of probability of presence of Asiatic black bear to (A): Elevation, (B): mean temperature of coldest quarter, (C): global land cover (D): precipitation of driest quarter. The red curves represent the mean trends while the blue shades show the mean +/- the standard deviation. In each graph, the x-axis shows the change in each environmental variable, while the y-axis shows the species’ probability of presence.