View larger version:
Download Original File
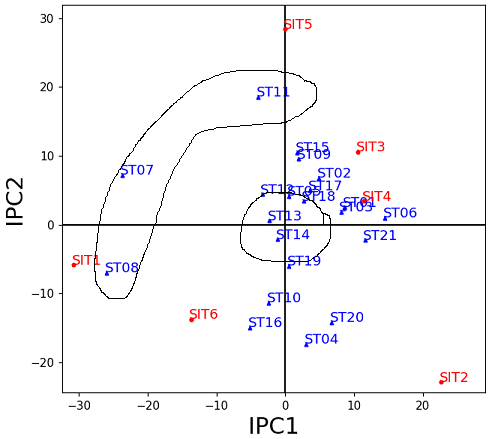
Figure 3:
AMMI biplot drawn between the first two IPC scores.