
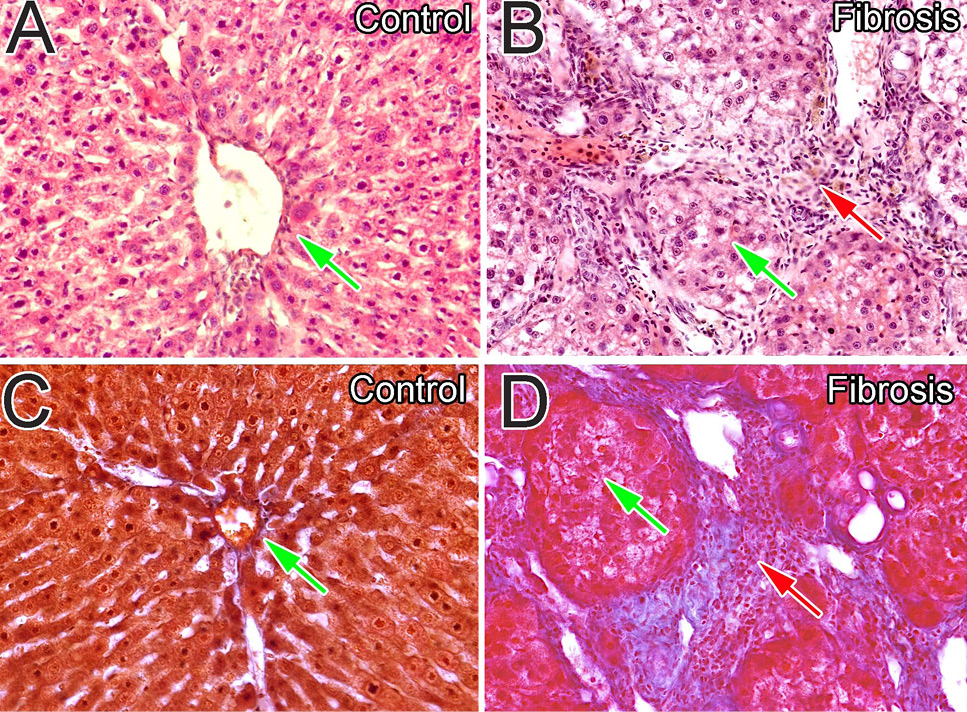
Fig. 3.
H&E and Masson’s trichrome staining of liver tissues of HCV infected patients. A, Stained with H/E, the control group with no sign of any abnormality; B, H/E shows cords of fibrosis with mixed infiltration of inflammatory cells; C, Masson’s trichrome staining normal control group with distinct shaped nuclei of hepatocytes and their ar-rangement in cords; D, Masson’s trichrome staining showing extensive fibrosis. The shapes of hepatic lobes and lobules were distorted in the fibrosis group.