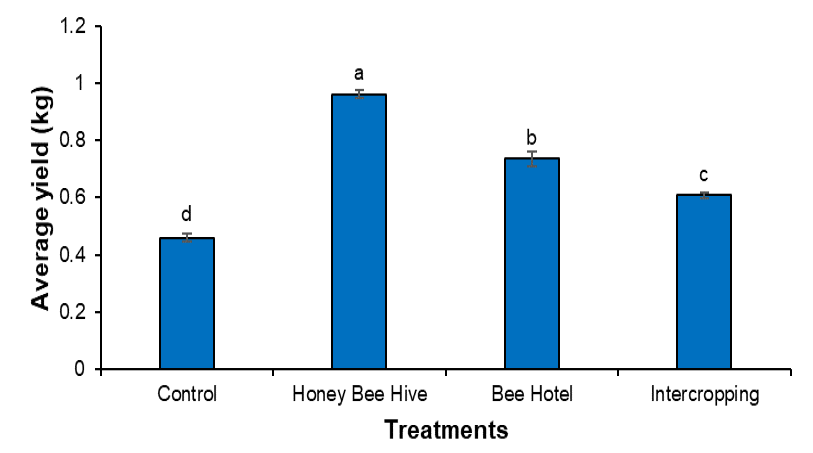
Figure 2:
Impact of different insect pollinator conservation strategies on the average yield per plant of round gourd. Bars and columns represent standard error and mean, respectively, of triplicate values. Small letters at bar tops represent statistical difference among treatments (one-way ANOVA followed by LSD at α = 0.05).