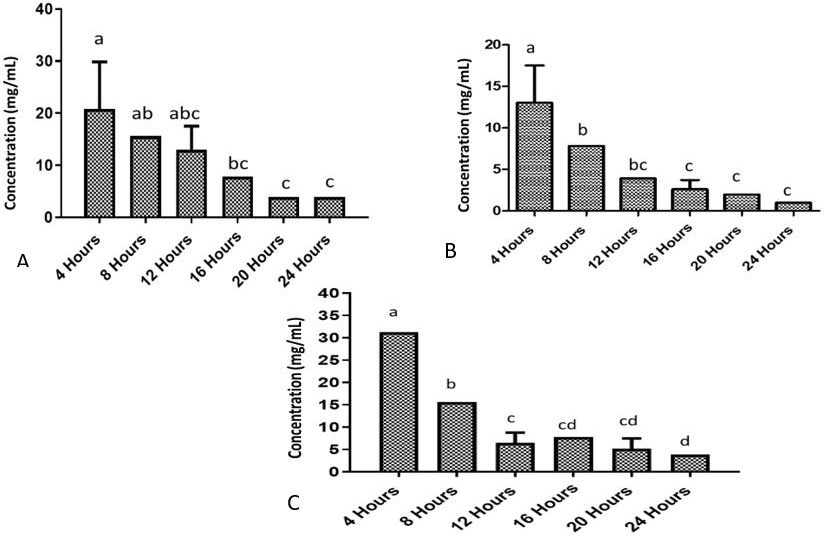
Fig. 3.
Comparison of MICs (mg/mL) among incubation periods (h) for each metallic oxide nanoparticle.
A, MIC of ZnO nanoparticle at different time intervals; B, MIC of MgO nanoparticle at different time intervals; C, MIC of Fe2O3 nanoparticle at different time intervals. NB, Different superscripts among different time intervals of incubations (4, 8, 12, 16, 20 and 24th h) indicate significant differences (p<0.05).