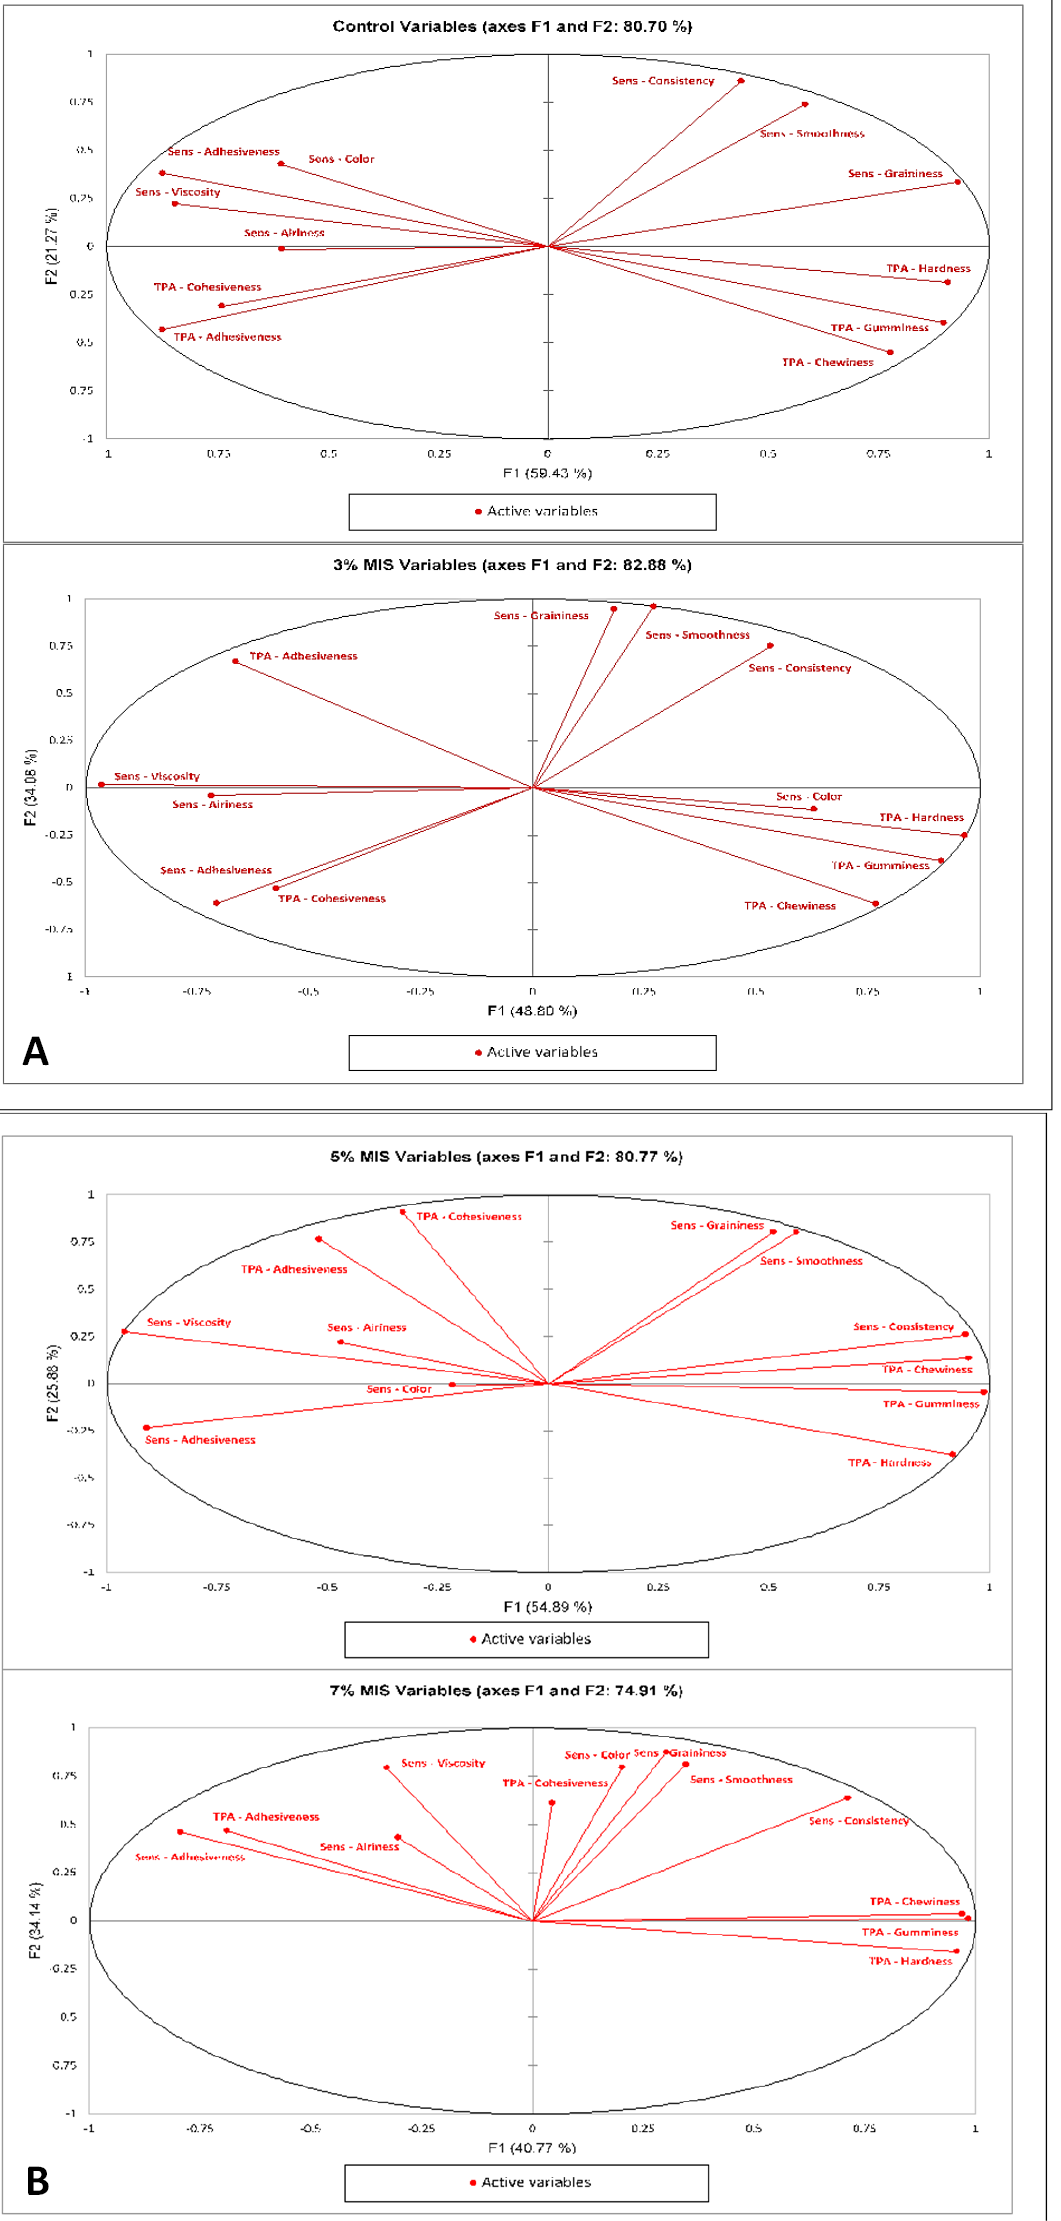
Figure 5:
From top to bottom: control 3% MIS (A) and 5% MIS (B) variables. Sens: sensory and TPA: Textural Profile Analysis.
From top to bottom: control 3% MIS (A) and 5% MIS (B) variables. Sens: sensory and TPA: Textural Profile Analysis.