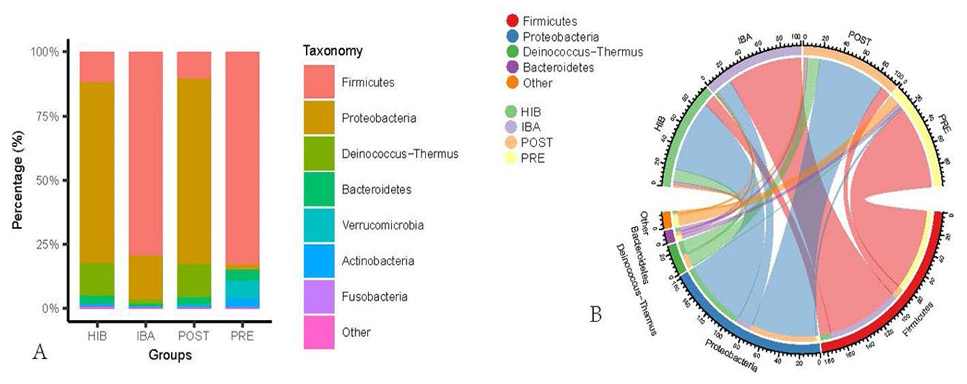
Fig. 6.
Bacterial community distribution at the phylum level. A, Stacked histogram of the intestinal bacterial abundance in each group at the phylum level (top 7). B, Chord diagram of intestinal bacterial abundance in each group at the phylum level (top 4).