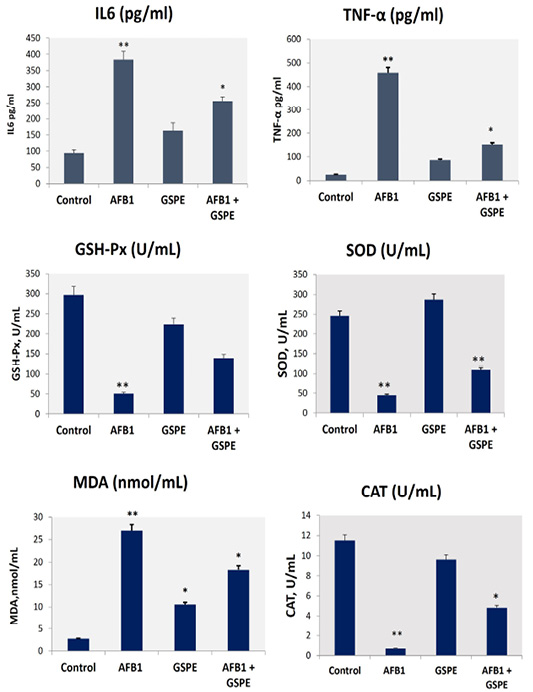
Figure 2:
Effects on AFB1-induced liver oxidative stress markers and serum inflammatory cytokines. Values are represented as the mean ± SE (n = 9). *column with different superscript letters were significantly different (p < 0.05). AFB1, aflatoxin B1); GSPE, grape seed proanthocyanidin; SOD, total superoxide dismutase; MDA, malondialdehyde; GSH-Px, glutathione peroxidase; CAT, catalase, IL6, interleukin-6; and TNF-α, Tumor necrosis factor-alpha.