View larger version:
Download Original File
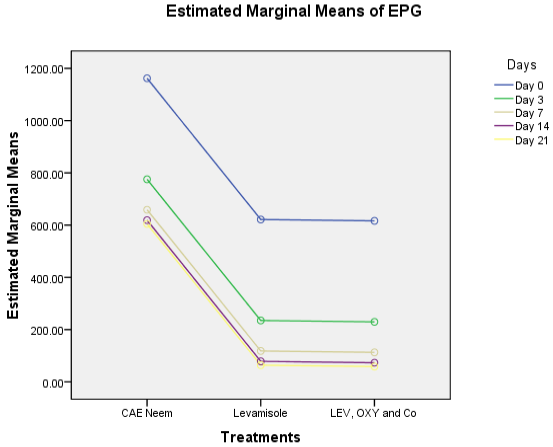
Figure 2:
Graph showing decrease in faecal egg count of treated group.