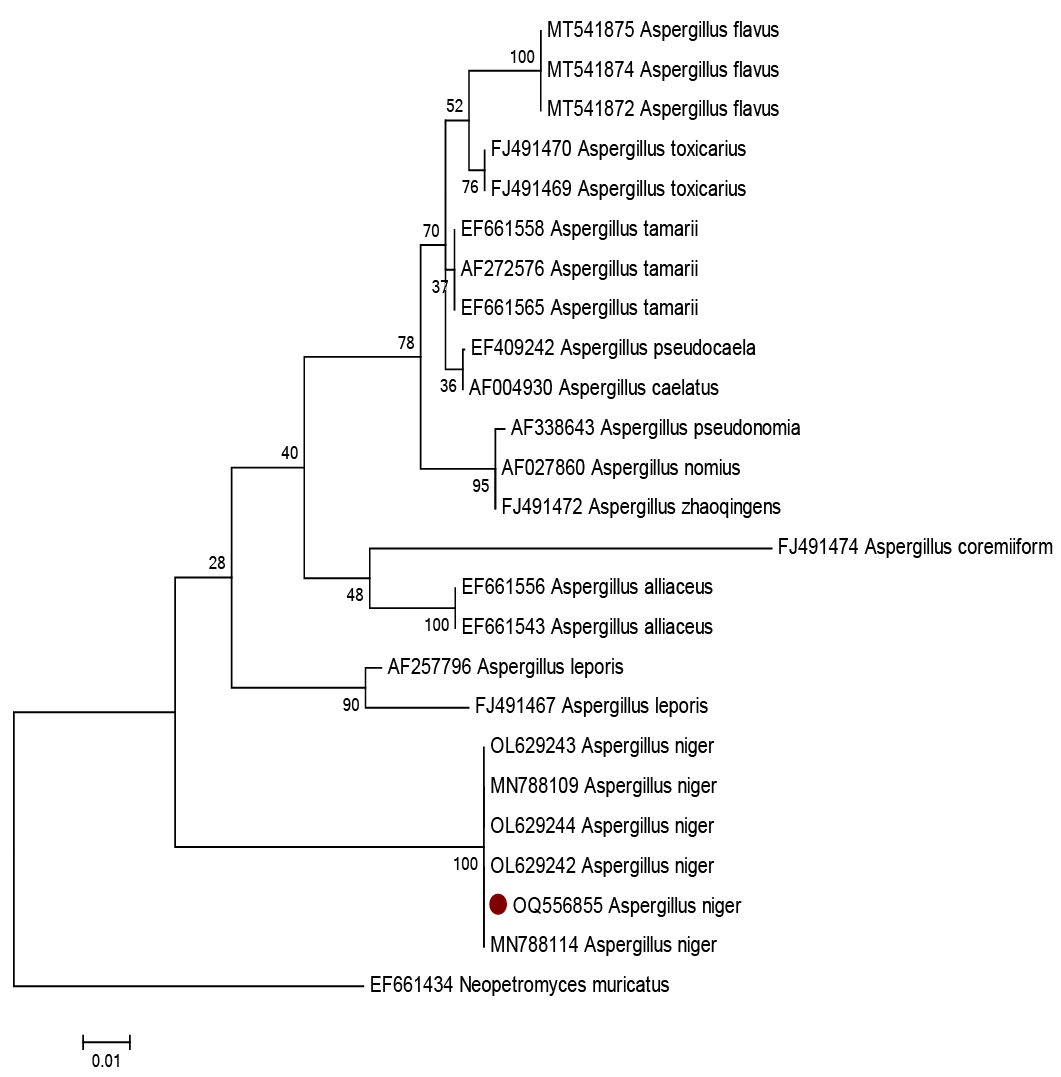
Figure 1:
The evolutionary history was inferred by using the maximum likelihood method based on the Tamura 3-parameter model. A discrete Gamma distribution was used to model evolutionary rate differences among sites (5 categories (+G, parameter= 0.2474)). The analysis involved 25 nucleotide sequences. Evolutionary analyses were conducted in MEGA6. The sequence generated in the present study is marked with.