
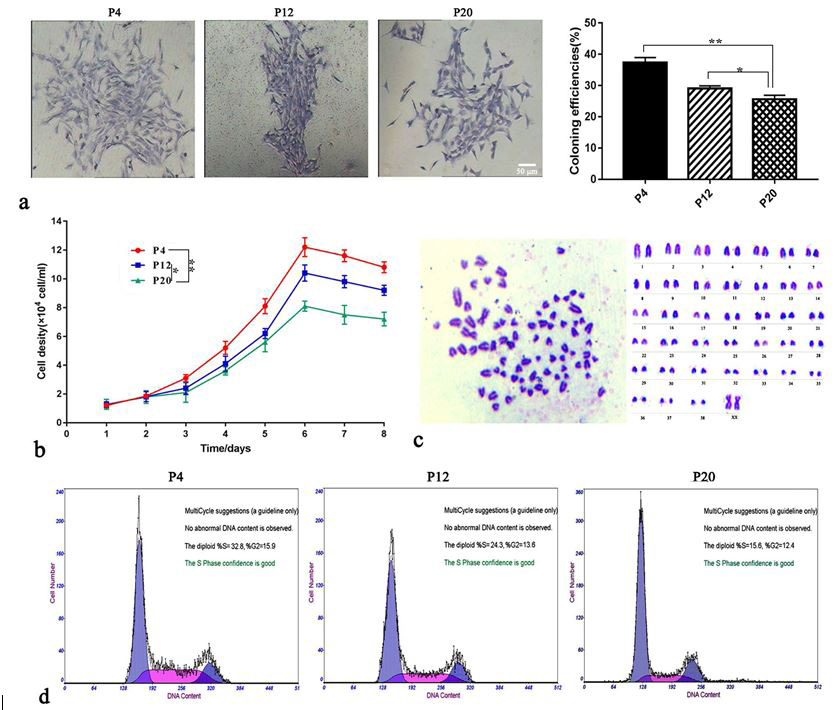
Fig. 2.
Karyotype and cell cycle analysis of proliferating CSPCs. (a) Colonies and morphology of CSPCs by Gimesa staining at P4, P12 and P20 (bar, 50 μm). Bar chart shows that colony forming efficiency of different passages; (b) Sigmoidal growth curves of CSPCs at different passages (P4/P12/P20); (c) Karyotype analysis of CSPCs (2n = 78); (d) Cell cycle analysis of P4, P12 and P20.