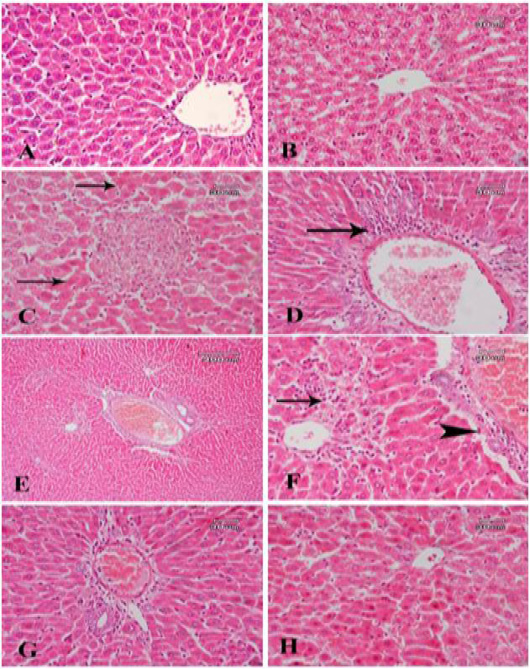
A photomicrograph of sections from liver tissue: (A) of control -ve group shows the normal structure of the hepatic lobule. (B) of a rat treated with corn oil shows a quite normal structure of liver tissue. (C) from a rat treated with bisphenol shows an area of necrotic cells with acidophilic hepatic cells (arrow) in the area around. (D) Another section for the same group shows dilatation of central vein with fibrosis and cellular infiltration around (arrow). (E) From a rat treated with bisphenol and Fagonia cretica (low dose) shows dilatation of central vein with fibrosis around is still noticed. (F) A higher magnification for a part of the previous section shows a slight reduction of fibrous tissue around vein (arrowhead) and dilated blood sinusoids with cellular infiltration (arrow). (G) A section from a rat treated with bisphenol and Fagonia cretica (medium dose) shows marked reduction of fibrous tissue and cellular infiltration around main blood vessels. (H) A section from a rat treated with bisphenol and Fagonia cretica (high dose) shows no fibrous tissue or cellular infiltration, but some acidophilic hepatic cells are still observed.