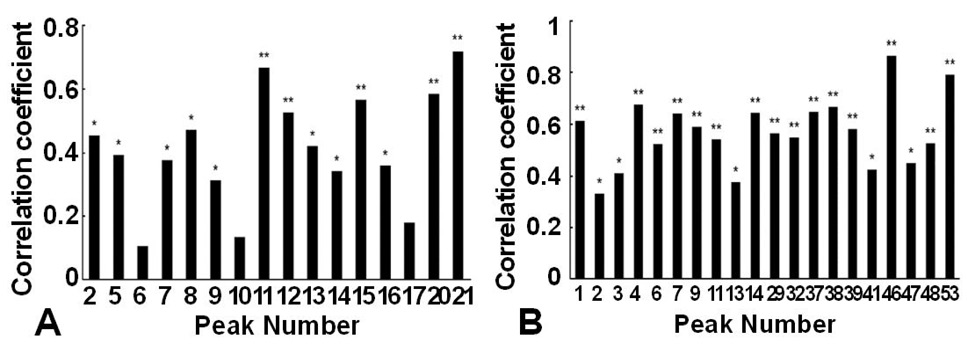
Fig. 2.
Bivariate analysis of estrogen activity and common peaks in serum TGs collected at different time points. (A) positive ion mode; (B) negative ion mode.
*significant correlation (p <0.05) when absolute value of correlation coefficient was >0.3; ** extremely significant correlation (p <0.01) when absolute value of correlation coefficient was >0.5.