
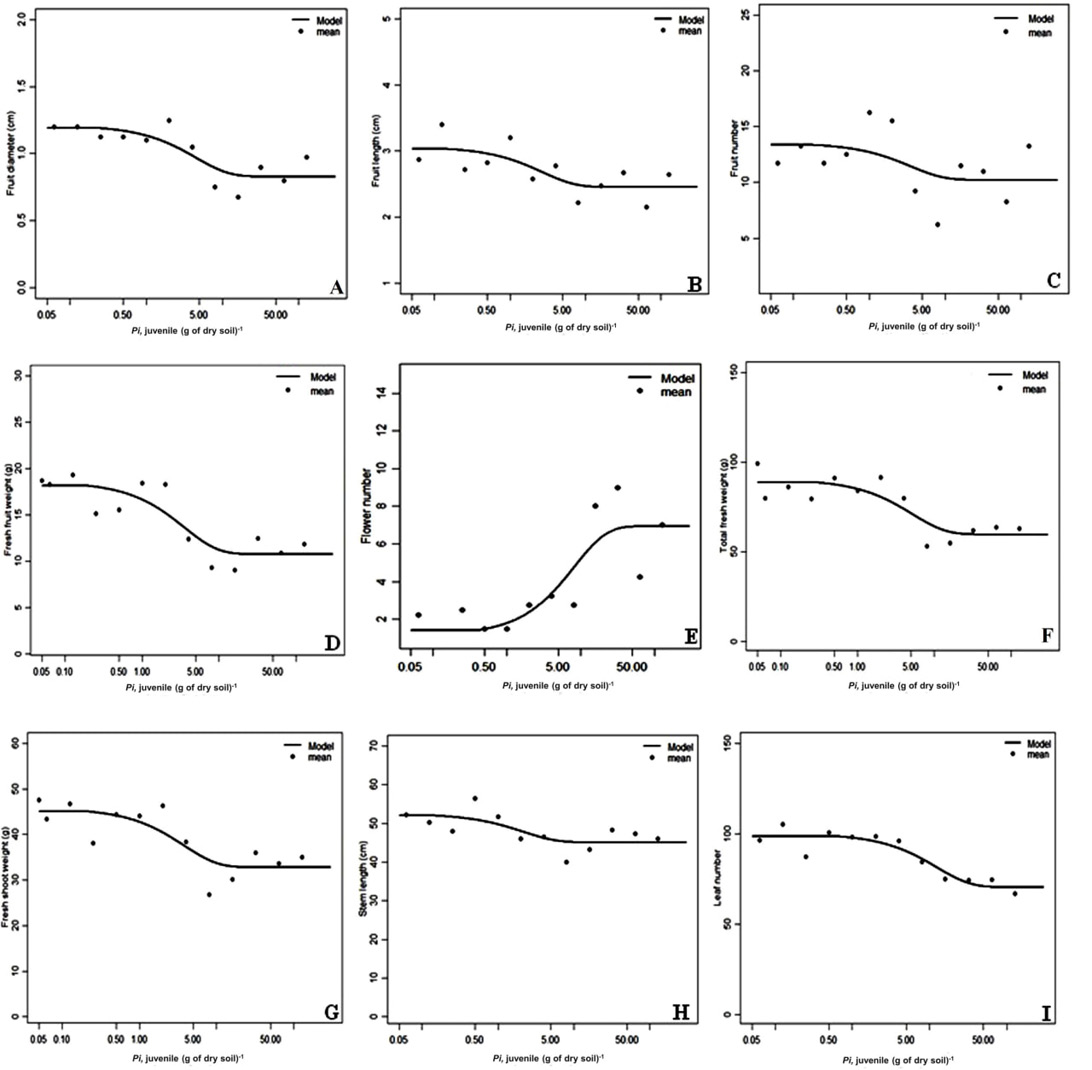
Figure 3:
The relation between the initial population density (Pi) of Meloidogyne incognita (plotted on a log scale) and mean of fruit diameter (A), fruit length (B), fruit number (C), fresh fruit weight (D), flower number (E), total fresh weight (F), fresh shoot weight (G), stem length (H), and leaf number(I). Dinsire was harvested after 120 days of inoculation, and each point represents a mean of 4 plants(replication), and the line is the predicted function obtained by fitting the Seinhorst yield loss model y= Ymax * (m+(1-m)*0.95((Pi/T)-1)) for Pi > y= 1 for Pi< T to the data.