
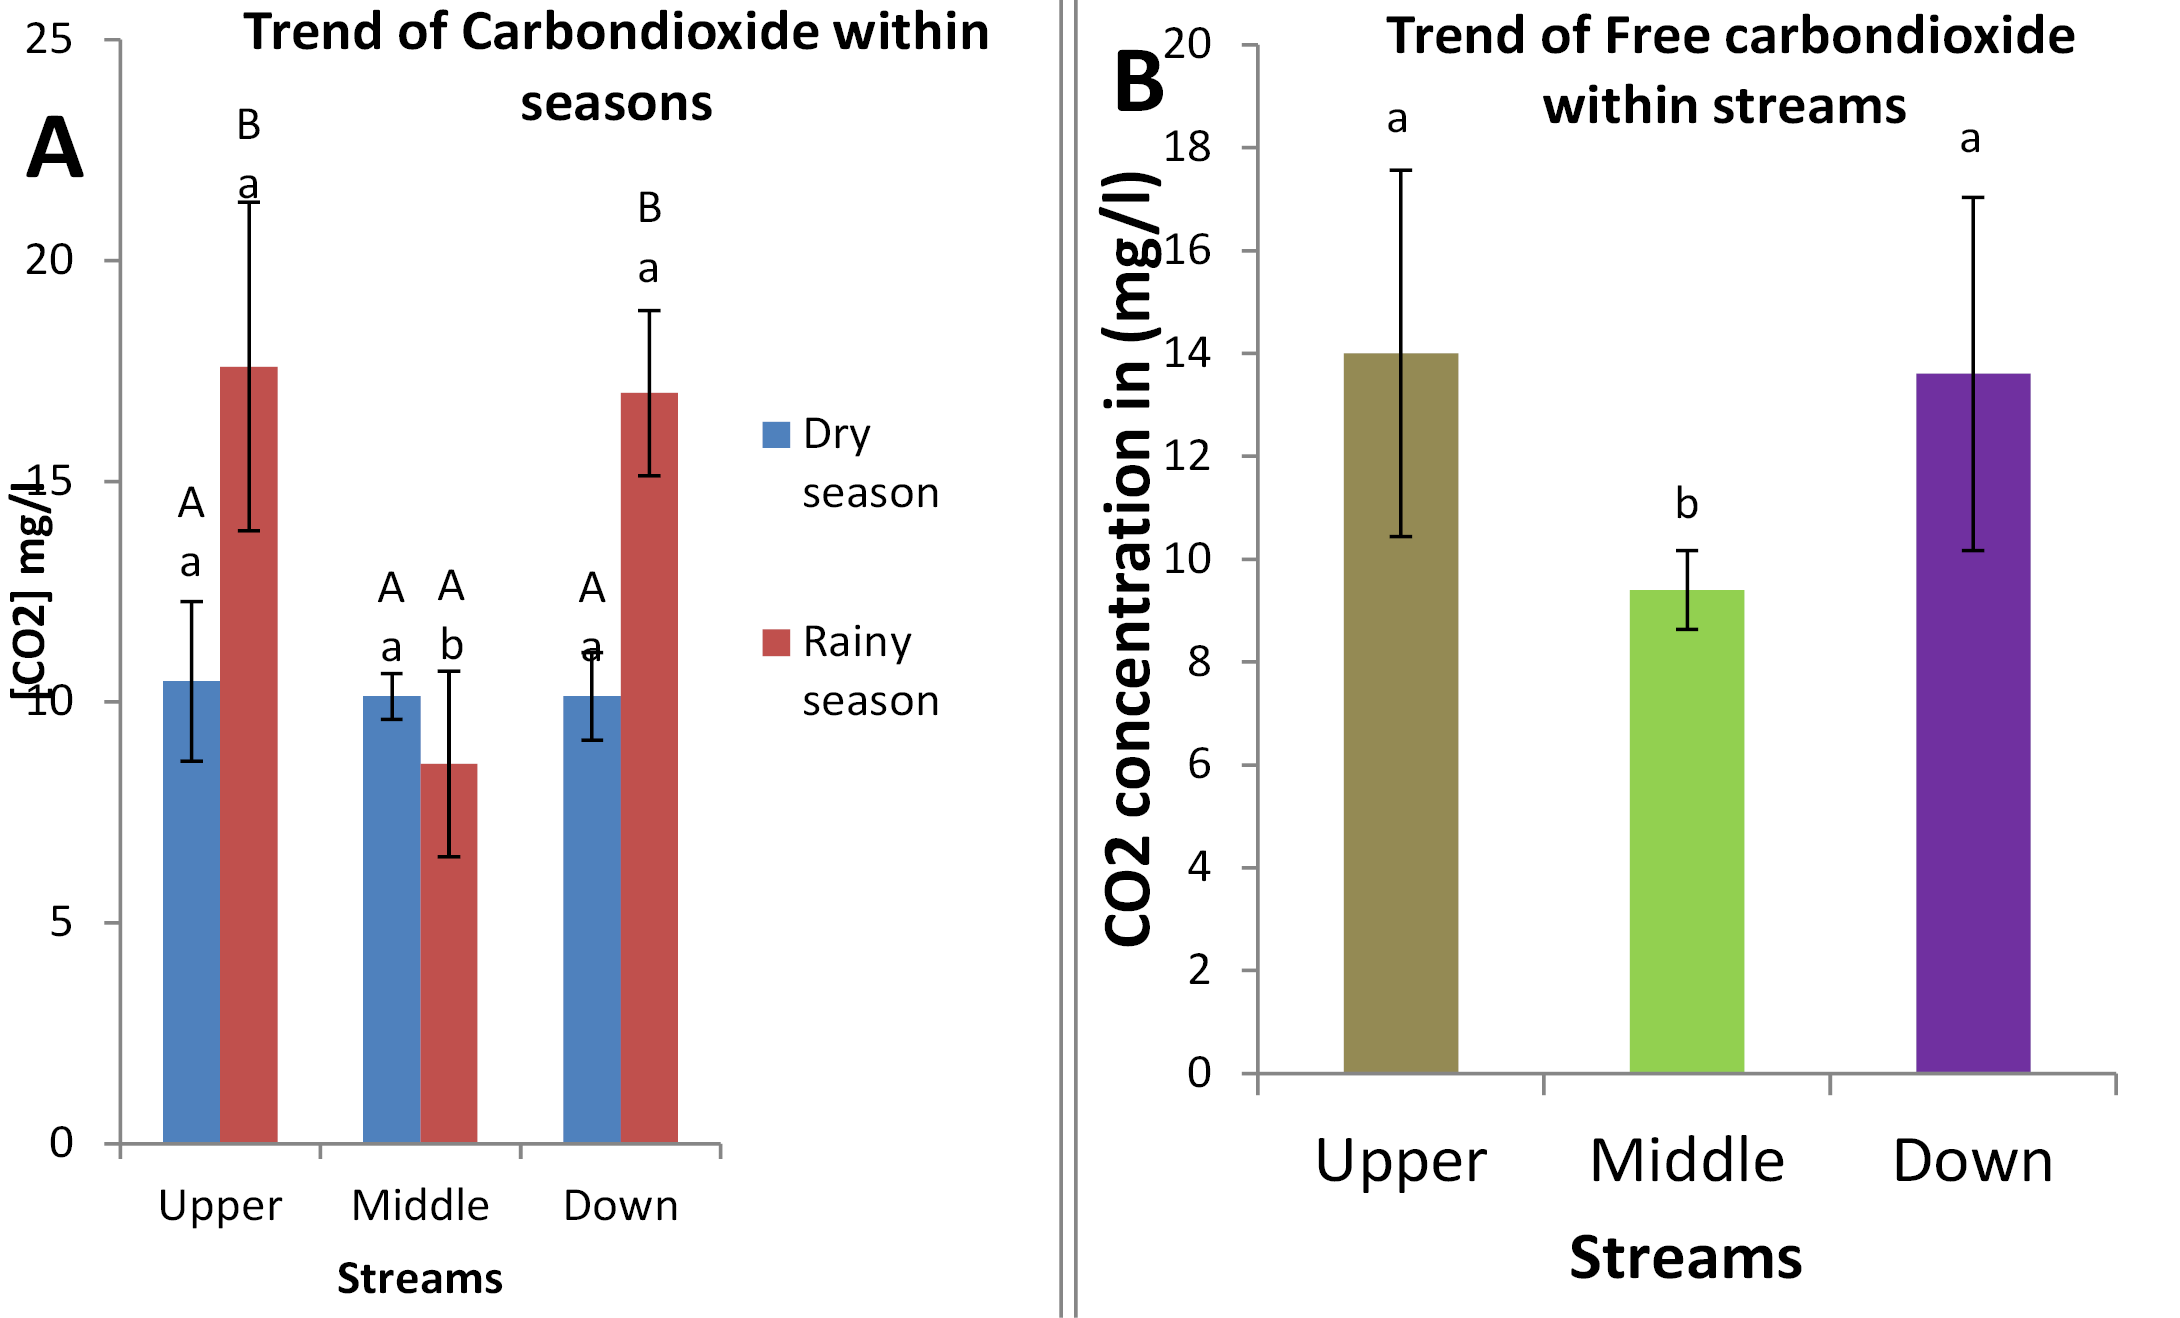
Figure 4:
Concentration of Carbon dioxide in the Guder river basins in dry and rainy seasons (A) and concentration of Carbon dioxide along Guder river basins in the whole year round (B). Values are (means ± S.E, n=5), different small letters (a, b, c) denote significant differences between different streams along the river basins. Capital letters (A, B, C) denote significant differences between dry and rainy seasons.