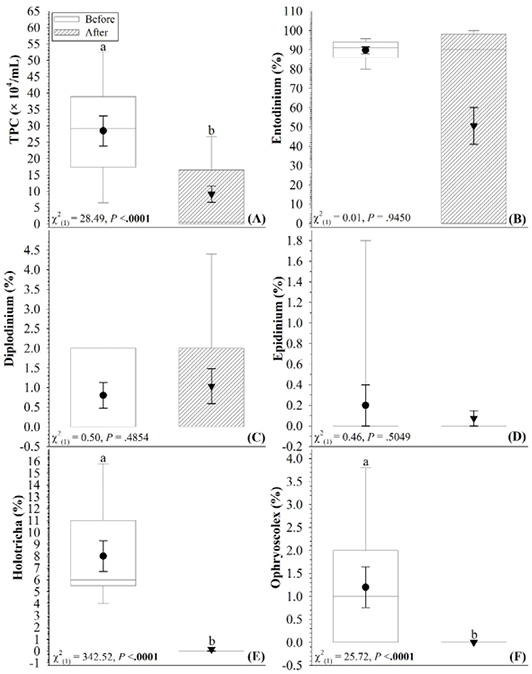
Figure 4:
Comparisons between values of different rumen protozoa examined in goats before and after defaunation. Within each box plot, vertical line indicates median, black symbol indicates mean, and error bars represent standard error of mean. Within the same parameter, data with different lowercase letters differ significantly between before and after defaunation at p < .05 if bold.
