
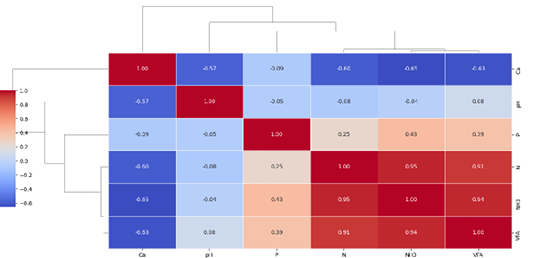
Figure 2:
Hierarchical correlation analysis of gamma radiation effects on multiple parameters.
The correlation heatmap visually displays the connections between certain mineral elements and rumen fluid characteristics, such as Calcium (Ca), pH, Phosphorus (P), Nitrogen (N), Nitrate (NH3), and Volatile fatty acid (VFA) in Pennisetum purpureum cv. Mot. Each square in the heatmap represents the magnitude and orientation of the correlation between two attributes. The colour gradient, which spans from blue (representing negative correlation) to red (representing positive correlation), visually depicts the strength and direction of these interactions. A darker hue of blue or red signifies a more pronounced link, whereas a lighter hue signifies a weaker or insignificant correlation.