
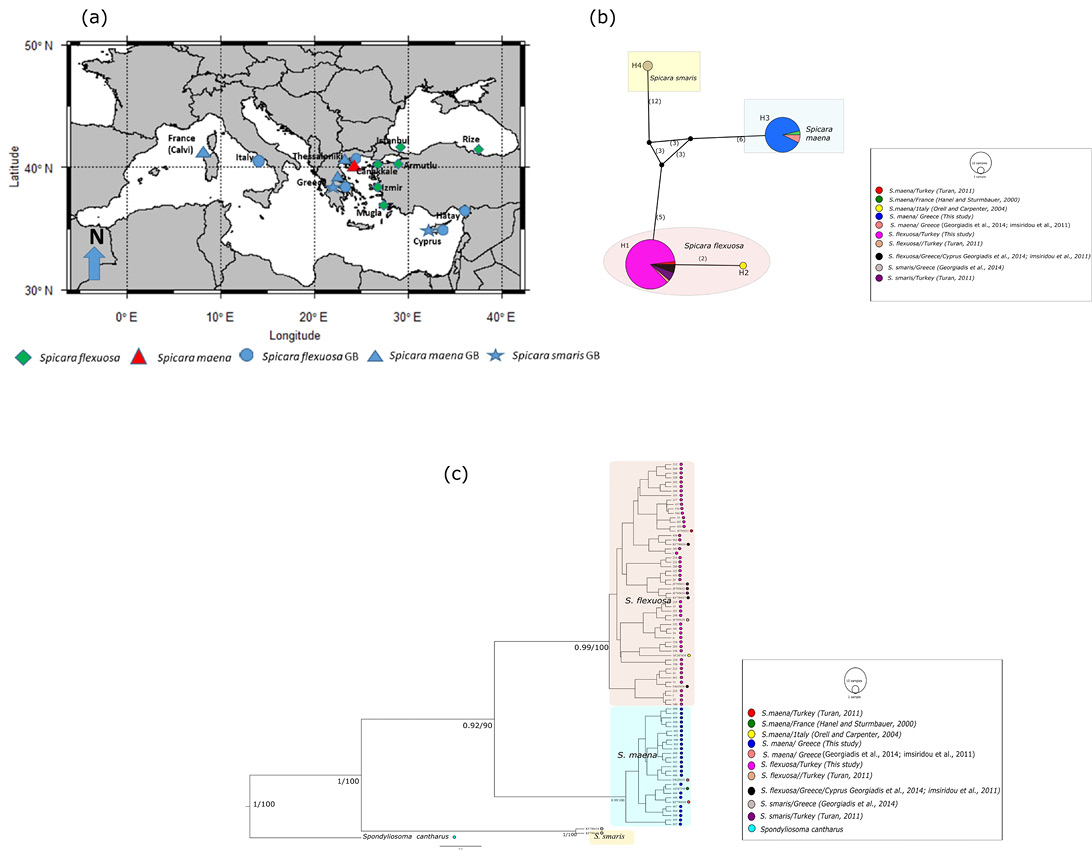
Figure 1:
(A) Map of sampling sites of three Spicara species in this study. Abbreviation is GB: GenBank. (B) The haplotype network based on 16S rRNA sequences of Spicara spp. generated for this study with Spicara spp. sequences available in GenBank. The numbers indicate the number of mutations between haplotypes. Small black circles between the three haplogroups represents missing haplotypes. (C) Phylogenetic trees of 16SrRNA gene of three Spicara species. The values above the branches are the BY posterior probabilities and ML bootstrap values, respectively.