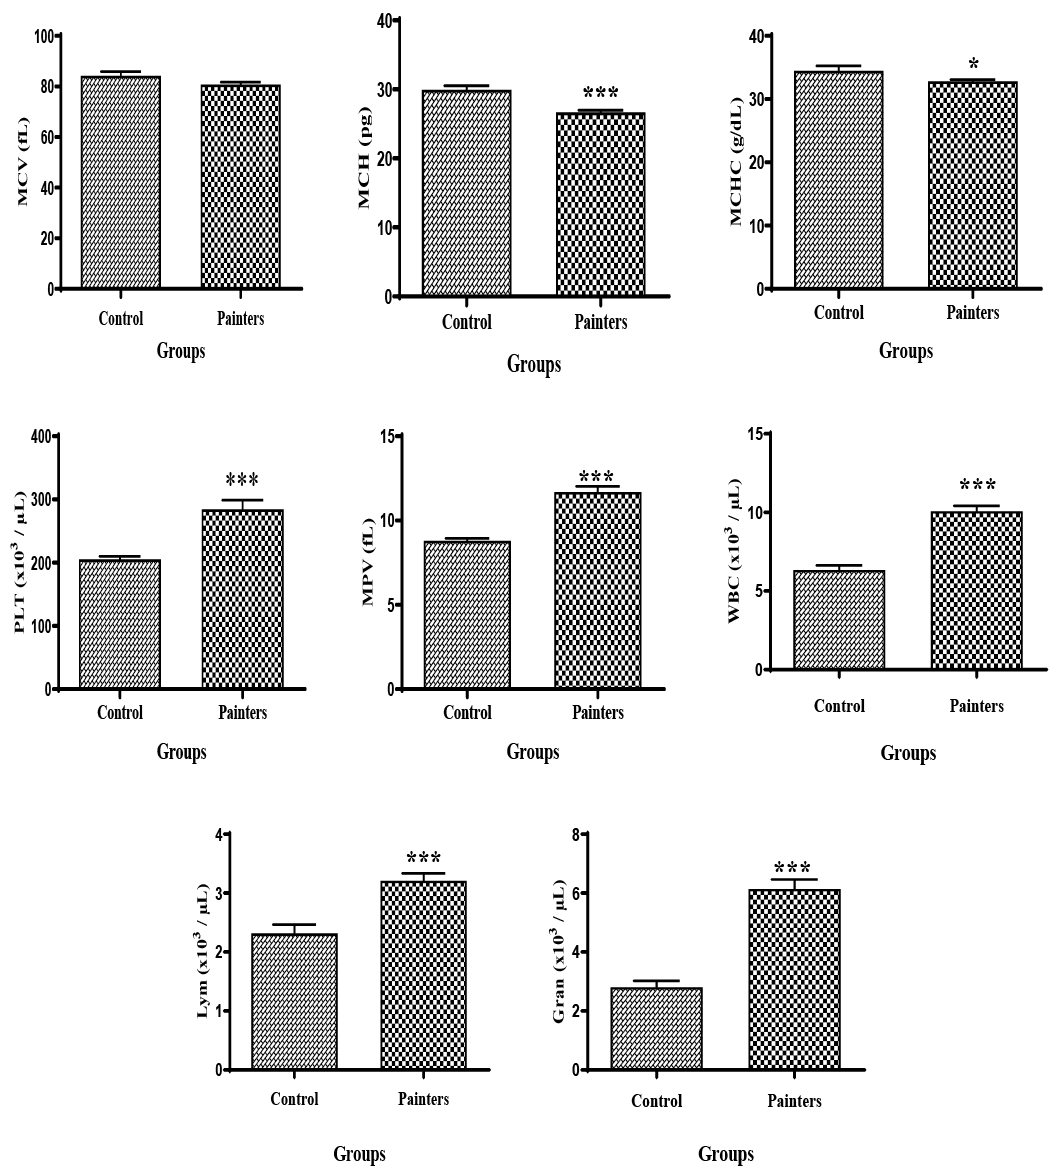
Figure 1:
Fluctuations in hematological parameters in the control and painters group. Values are (mean ± SEM). *, **, *** Significant at (P< 0.05, 0.01, 0.001), respectively.
Fluctuations in hematological parameters in the control and painters group. Values are (mean ± SEM). *, **, *** Significant at (P< 0.05, 0.01, 0.001), respectively.