
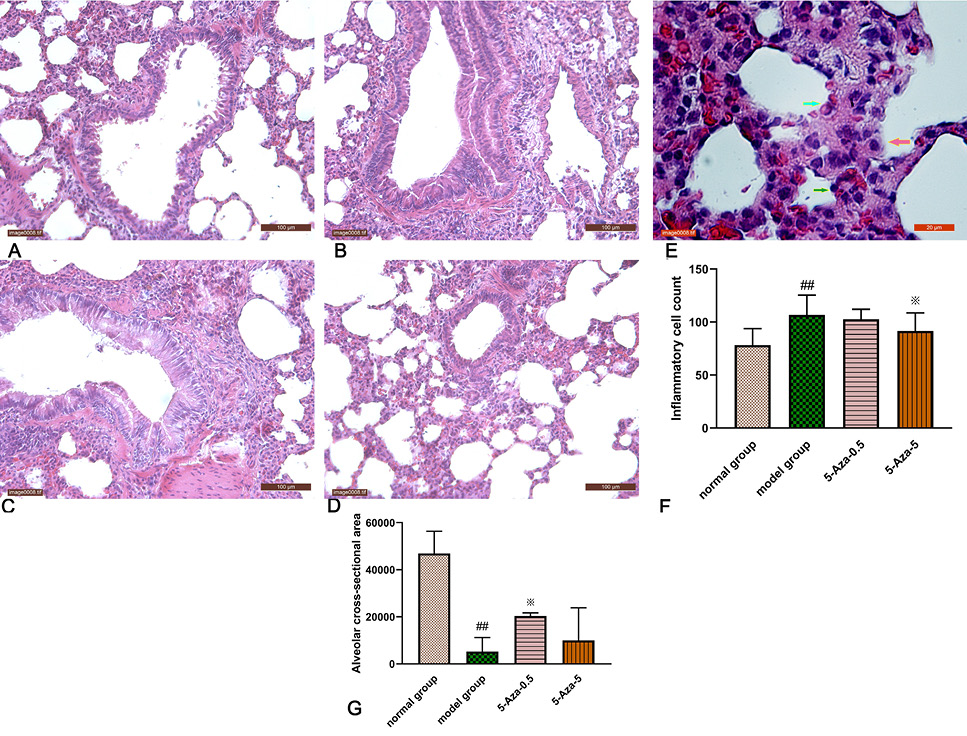
Fig. 3.
Lung inflammation in lungs in different groups (×10). Compared with the model group, the 5-aza group had less lumen stenosis, mucosal epithelial development and bronchial secretion storage. (A), Normal group; (B), Model group; (C), 5-Aza-0.5 group; (D), 5-Aza-5 group. (E), Graph of inflammatory cell infiltration in HPF of model group. Lymphocytes (green arrows), eosinophils (blue arrows), and monocytes (pink arrows). (F), Statistics of the number of inflammatory cells in HPF. (G), Semiquantitative analysis of alveolar cross-sectional area.