
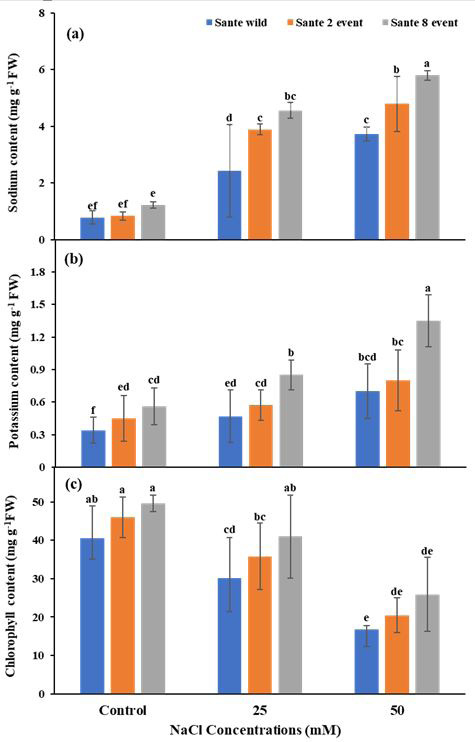
Figure 3:
Mean Sodium (a), Potassium (b) and Chlorophyll (c) contents of potato plants of different varieties treated with different levels of NaCl. Vertical bars indicate ± SE of means. Means not sharing similar letters are significantly different by LSD test at P ≤ 0.05.