View larger version:
Download Original File
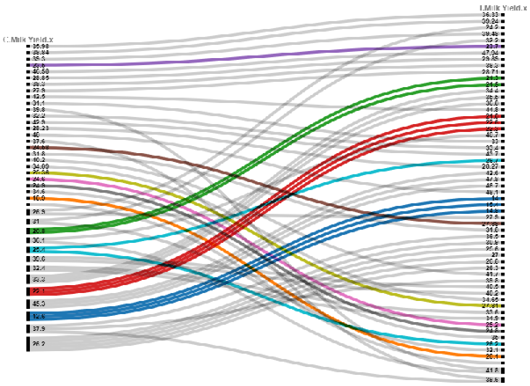
Figure 7:
Alluvial diagram for fluctuating engagement of control and treatment milk yields among observations.