
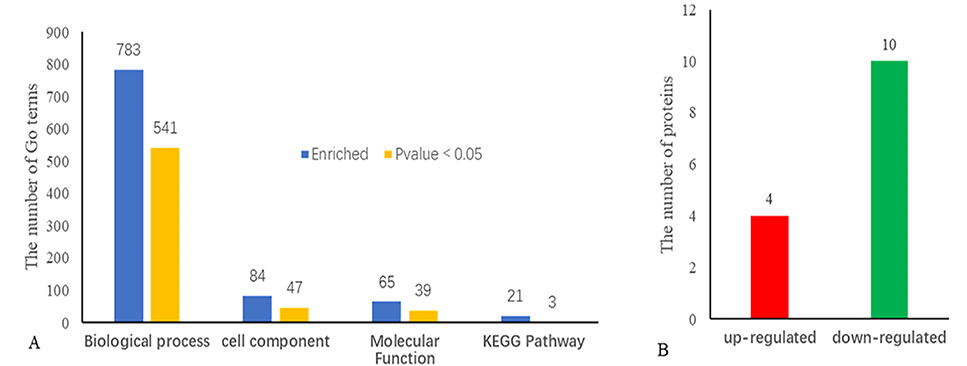
Fig. 2.
(A) Summary of the total number of GO hits. (B) Total number of upregulated and downregulated proteins using LFQ analysis.
(A) Summary of the total number of GO hits. (B) Total number of upregulated and downregulated proteins using LFQ analysis.