
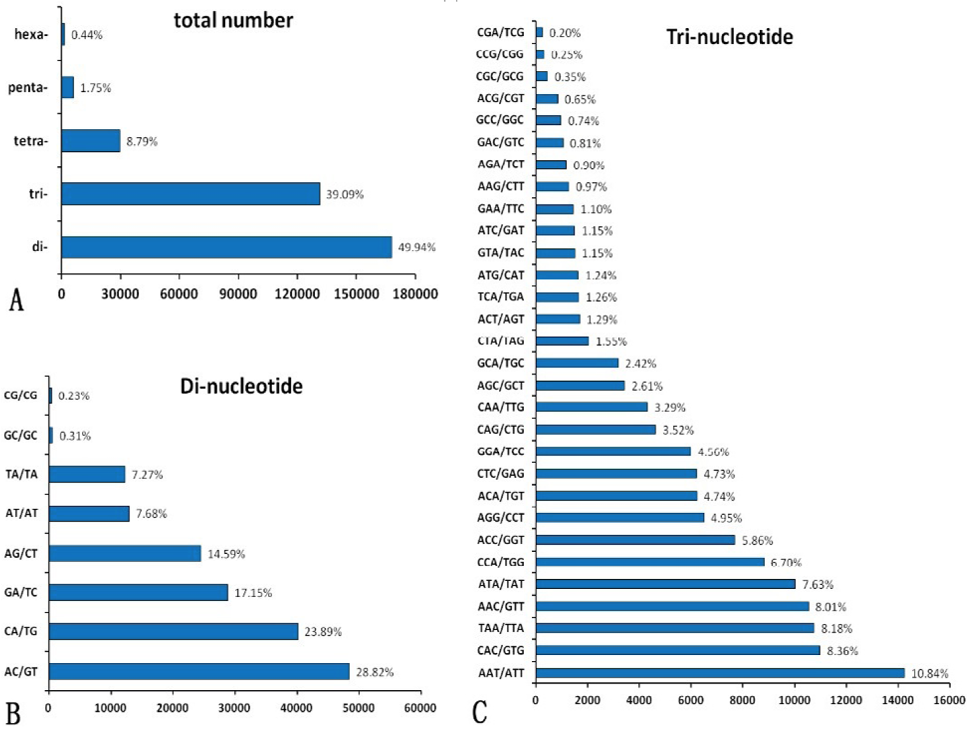
Fig. 2.
Distribution of SSR motifs in Procambarus clarkii. The Y-axis represents motif types and the X-axis represents the count of motifs in whole genome of Procambarus clarkii.
Distribution of SSR motifs in Procambarus clarkii. The Y-axis represents motif types and the X-axis represents the count of motifs in whole genome of Procambarus clarkii.