
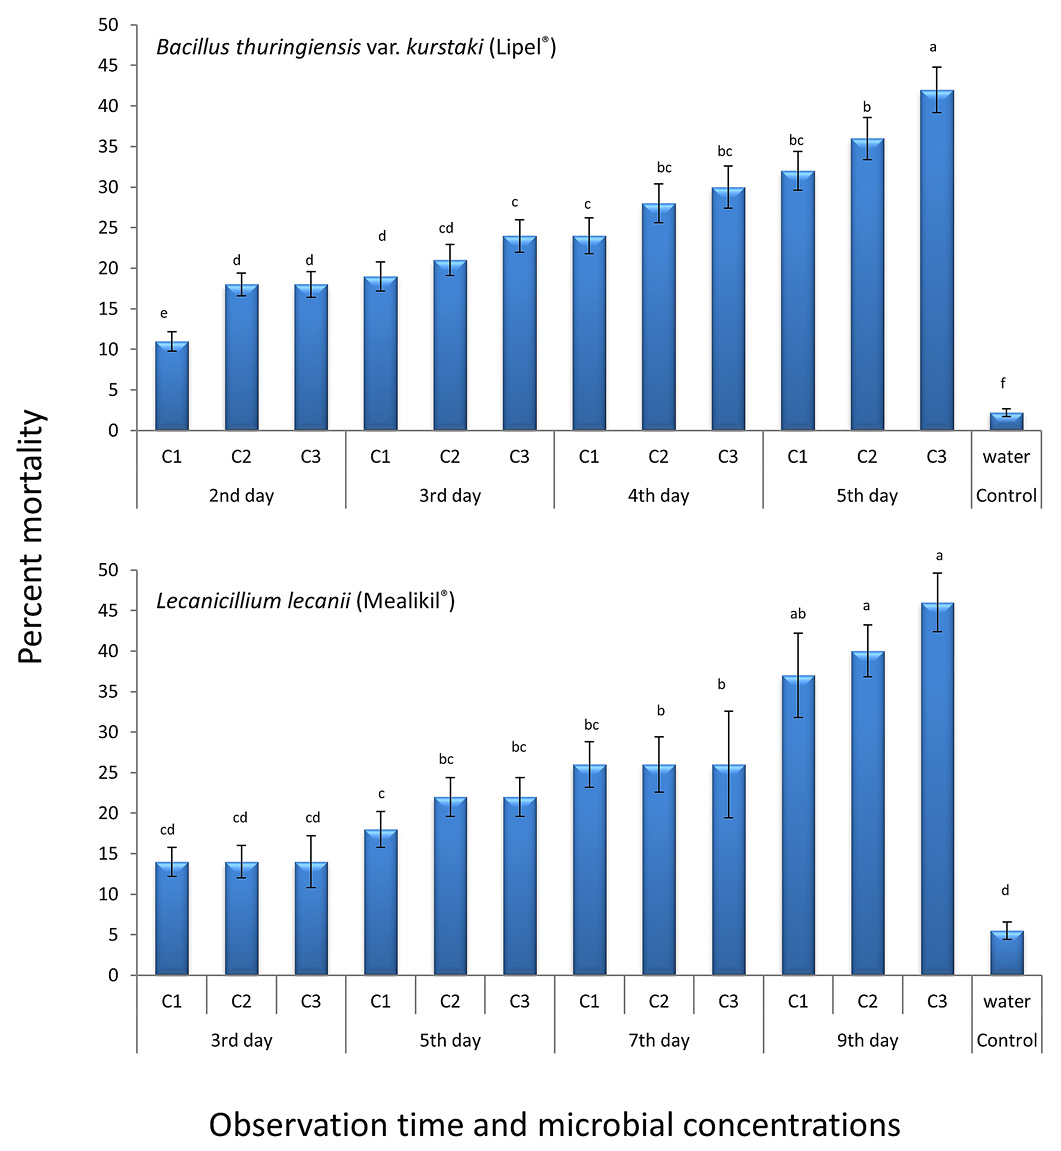
Figure 3:
Percent mortality (mean ± SE; n = 5) of 5th instar larvae of khapra beetle Trogoderma granarium exposed to different concentrations of commercial microbial formulations recorded at different time intervals. For each formulation, different alphabets at the bar tops indicate significant difference among the treatments (factorial ANOVA; Tukey’s HSD at α = 0.05).