
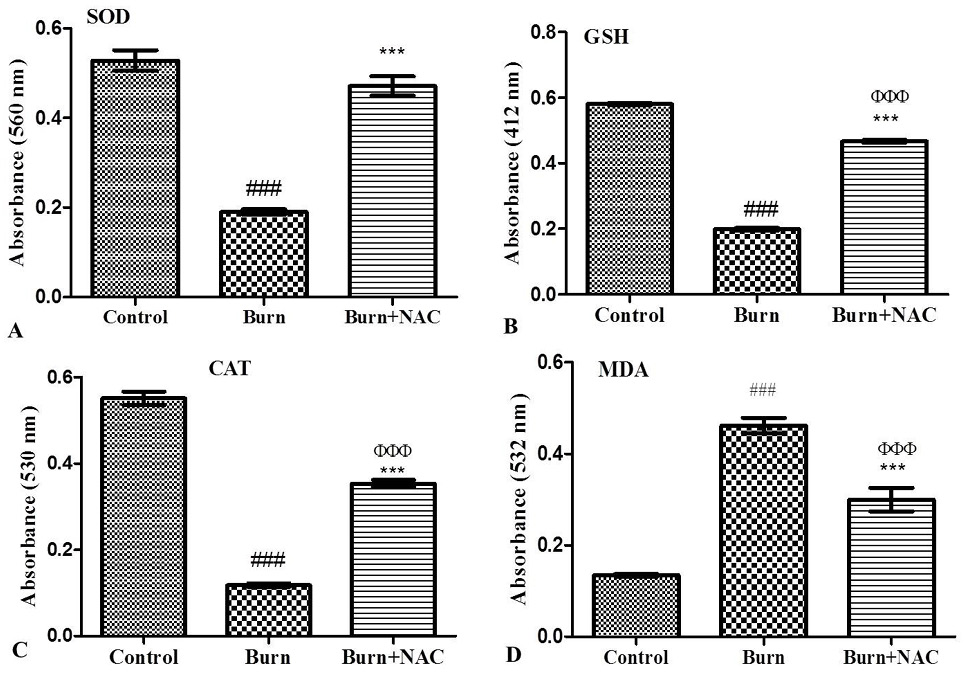
Fig. 3.
Assessment of oxidative stress markers in treatment groups. A, Superoxide dismutase (SOD); B, Reduced glutathione (GSH); C, Catalase (CAT); D, Malondialdehyde (MD A). Error bars represent ± standard error of mean (SEM). Control versus burn group, #P < 0.05; ##P < 0.01; and ###P < 0.001; Control versus Burn+NAC group, ΦP < 0.05; ΦΦP < 0.01; and ΦΦΦP < 0.001; Burn versus Burn+NAC group, *P < 0.05; **P < 0.01; and ***P < 0.001.