
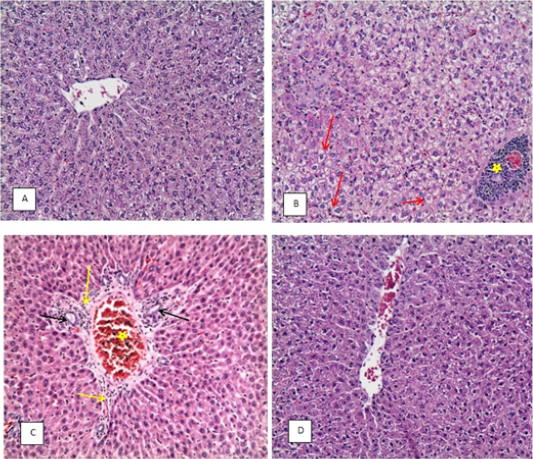
Figure 4:
(H&E X20). A: liver of CG, B: liver of TG showing congestion, area of coagulative necrosis with inflammatory cell infiltration (star) and vacuolar degeneration of hepatocytes (red arrow), C: liver of DAG showing congestion and edema (star), infiltration of inflammatory cells (yellow arrow), newly formed bile duct (black arrow) and dilatation of hepatic sinusoids, D: liver of BG more or less to normal with slight congestion.