View larger version:
Download Original File
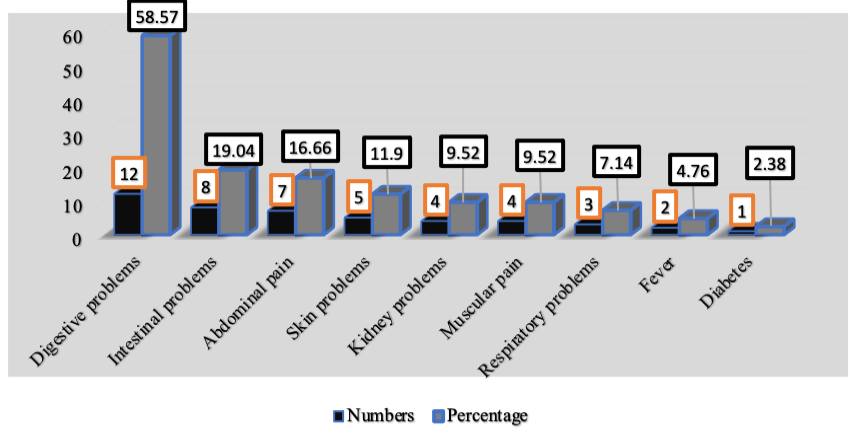
Figure 5:
Graph representing numbers and percentages of diseases treated.