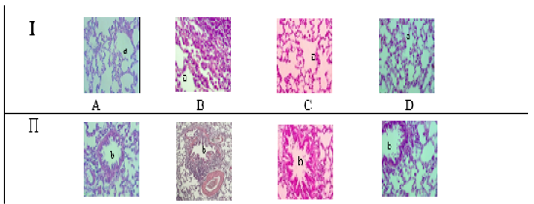
Figure 5
Histopathology of rat lung tissue in response to dipyridamole. Images of lung tissue taken using an X-40 light microscope. Alveolar Sac (a) in Section I. The bronchi in Section (II) (b). Group A is the negative control; Group B is the positive control; Group C is the Dipyridamole-treated group; Group D is the group treated with prednisolone.