
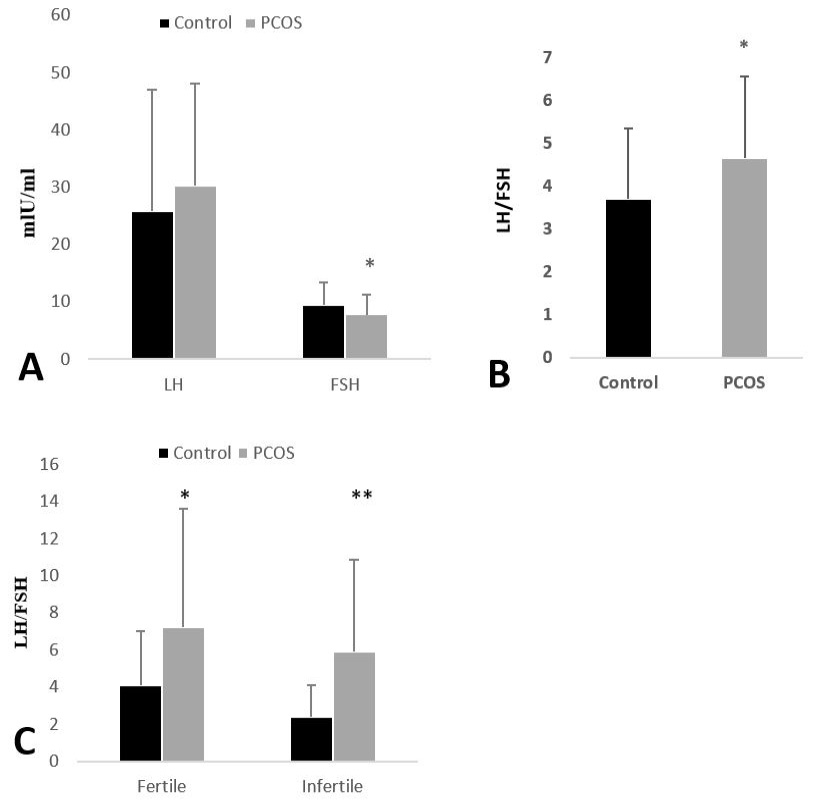
Figure 4:
(A) Mean serum LH and FSH level in control and PCOS groups. (B) Serum LH/FSH ratio in PCOS subjects as compared to healthy females. (C) Mean serum LH/FSH ratio in fertile and infertile PCOS patients and control females. Values are expressed as Mean ± SD and comparison is made by two-tailed T-Test. **P<0.01, ***P<0.001.