
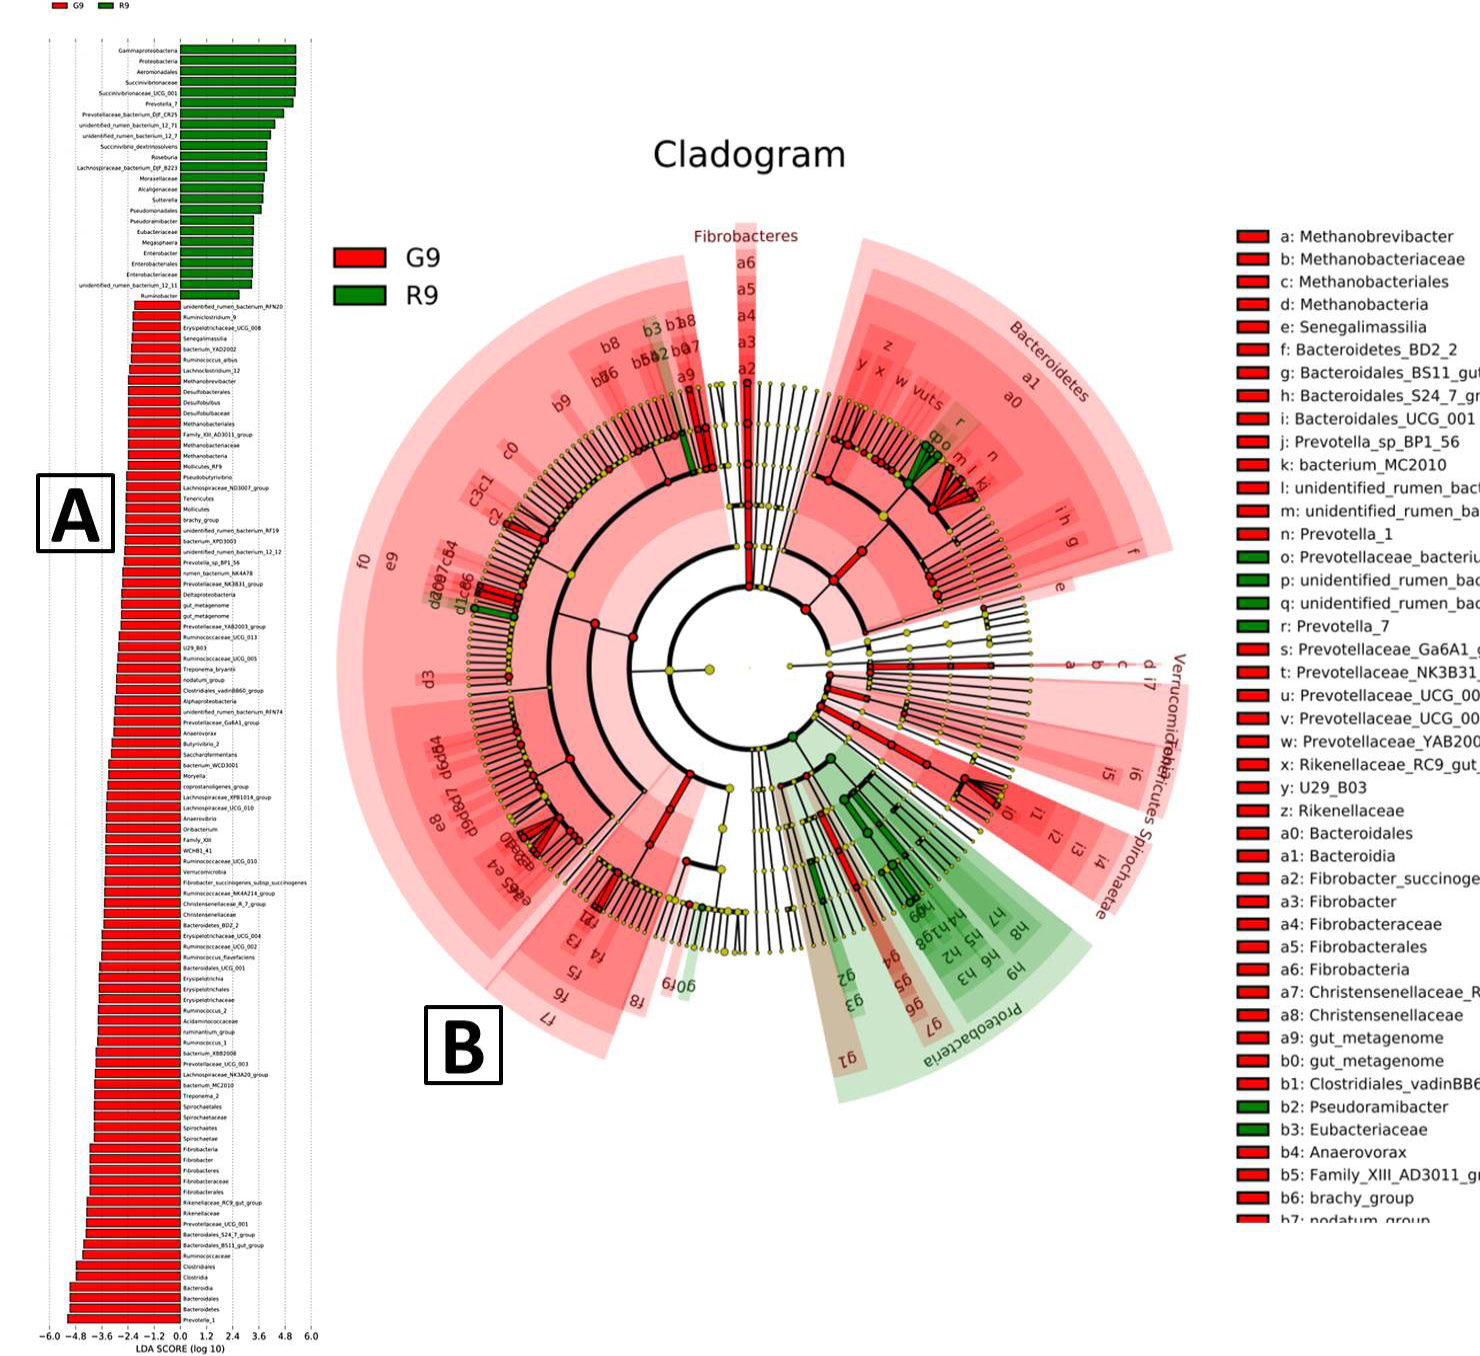
Fig. 8.
Rumen microorganism LEFse difference analysis of grazed (G9) and house-raised (R9) Tan sheep. Red represents the grazing group and green represents the house-raising group. A, linear discriminant analysis (LDA); B, evolutionary branching. In the evolutionary branching diagram, the circles that radiate from inside to outside represent the taxonomic level from phylum to genus (or species). Each small circle at the different classification levels represents a classification at that level. The diameter of the small circle is proportional to the relative abundance. For the coloring scheme, the species that are not significantly different are uniformly colored yellow.