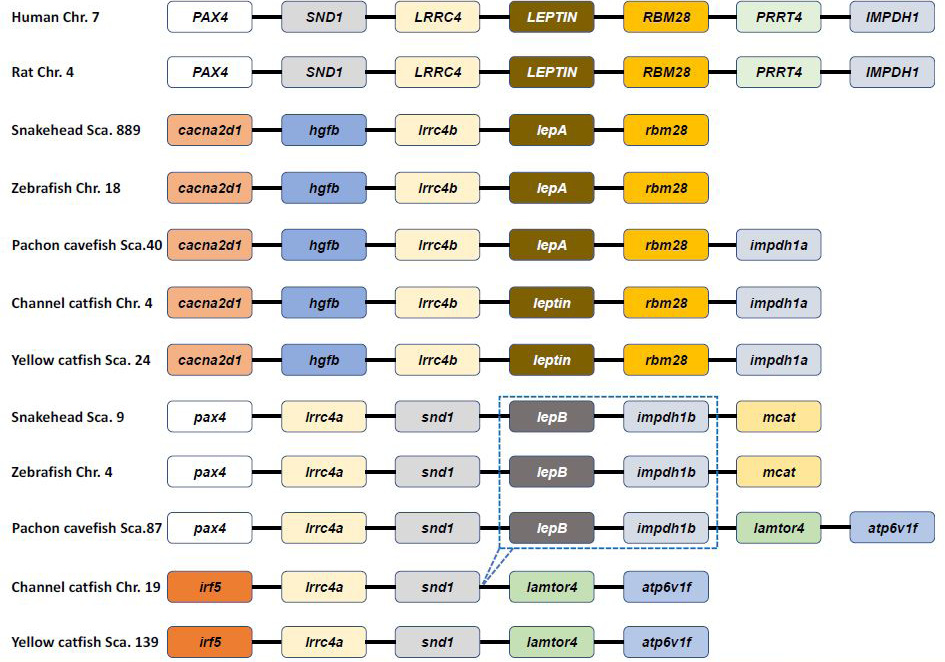
Fig. 3.
Genetic synteny comparison of Pvleptin and its homologs in vertebrates. The colorful blocks and solid lines represent genes and intergenic regions, respectively. The specific cluster (lepB-impdh1b) that has lost in siluriformes are marked by dotted box.