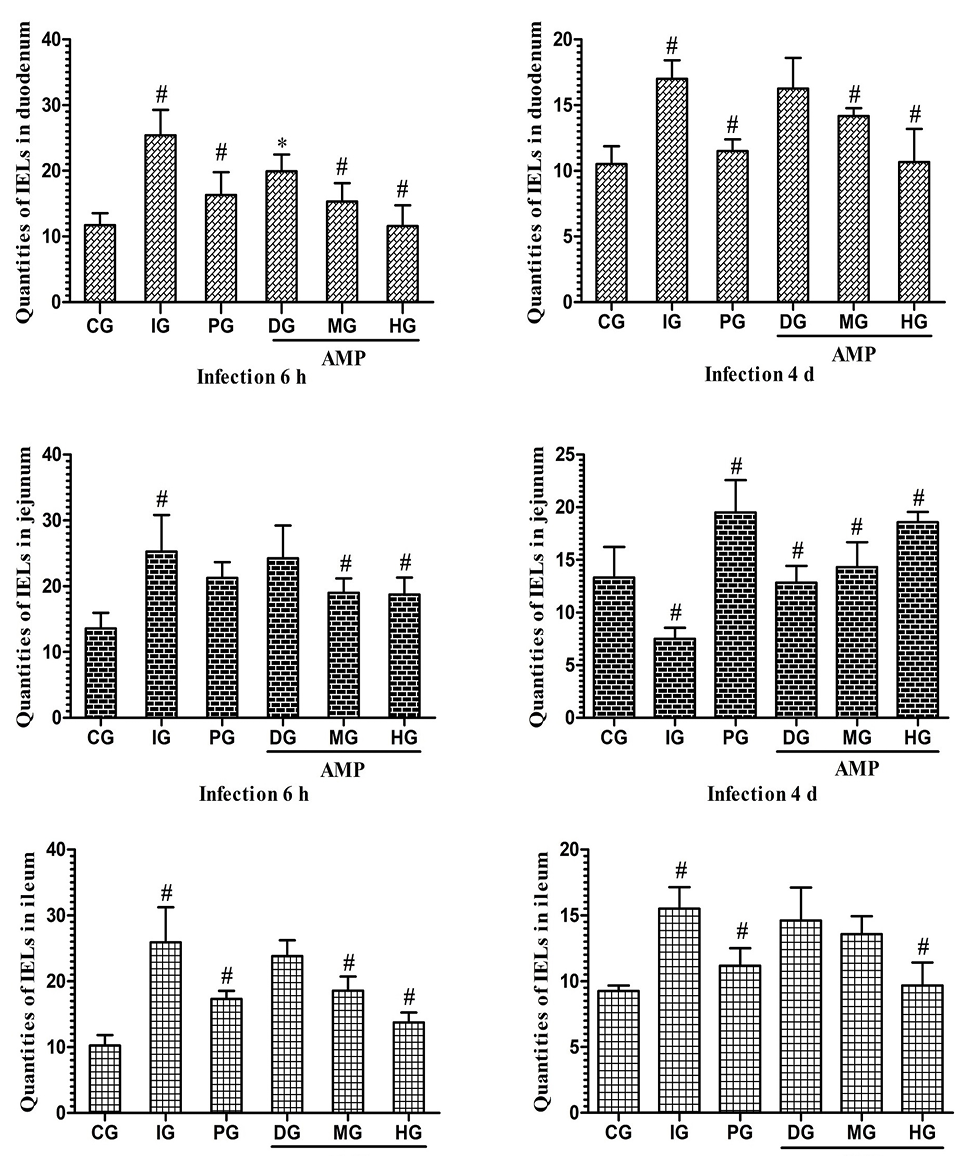
Fig. 4.
Quantity of iIELs in the small intestine of mice at 6 h and 4 d.
The quantity of iIELs in the small intestine at 6h and 4d respectively. The results are expressed in arbitrary unit and quantity is compared from the control group. Symbols # and * indicates the P<0.01 and P<0.05 respectively in the small intestine.