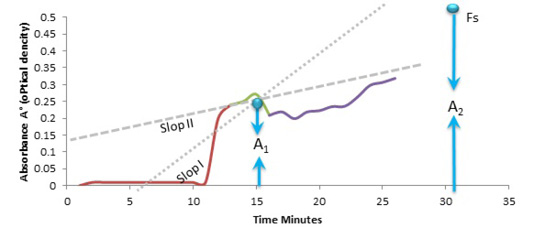
Figure 1:
Turbidimetric analysis of sperm motility plotted a graph of sperm kinetic sperm motility modified from (Al-Bayaty, 1999) A1: the distance from the x-axis to the point of cross between slop tends of a fraction of rapidly moving sperm and plateau maintenance sperm curve A 2: the maximum distance between the axis to the point of absorbance of mixed semen suspensions. Slop 1: The slop one Rabidly Moving Sperm. Slop 2: Ordinary sperm moving. Fs: The total sperm count in the whole sample (sperm/ ml).
