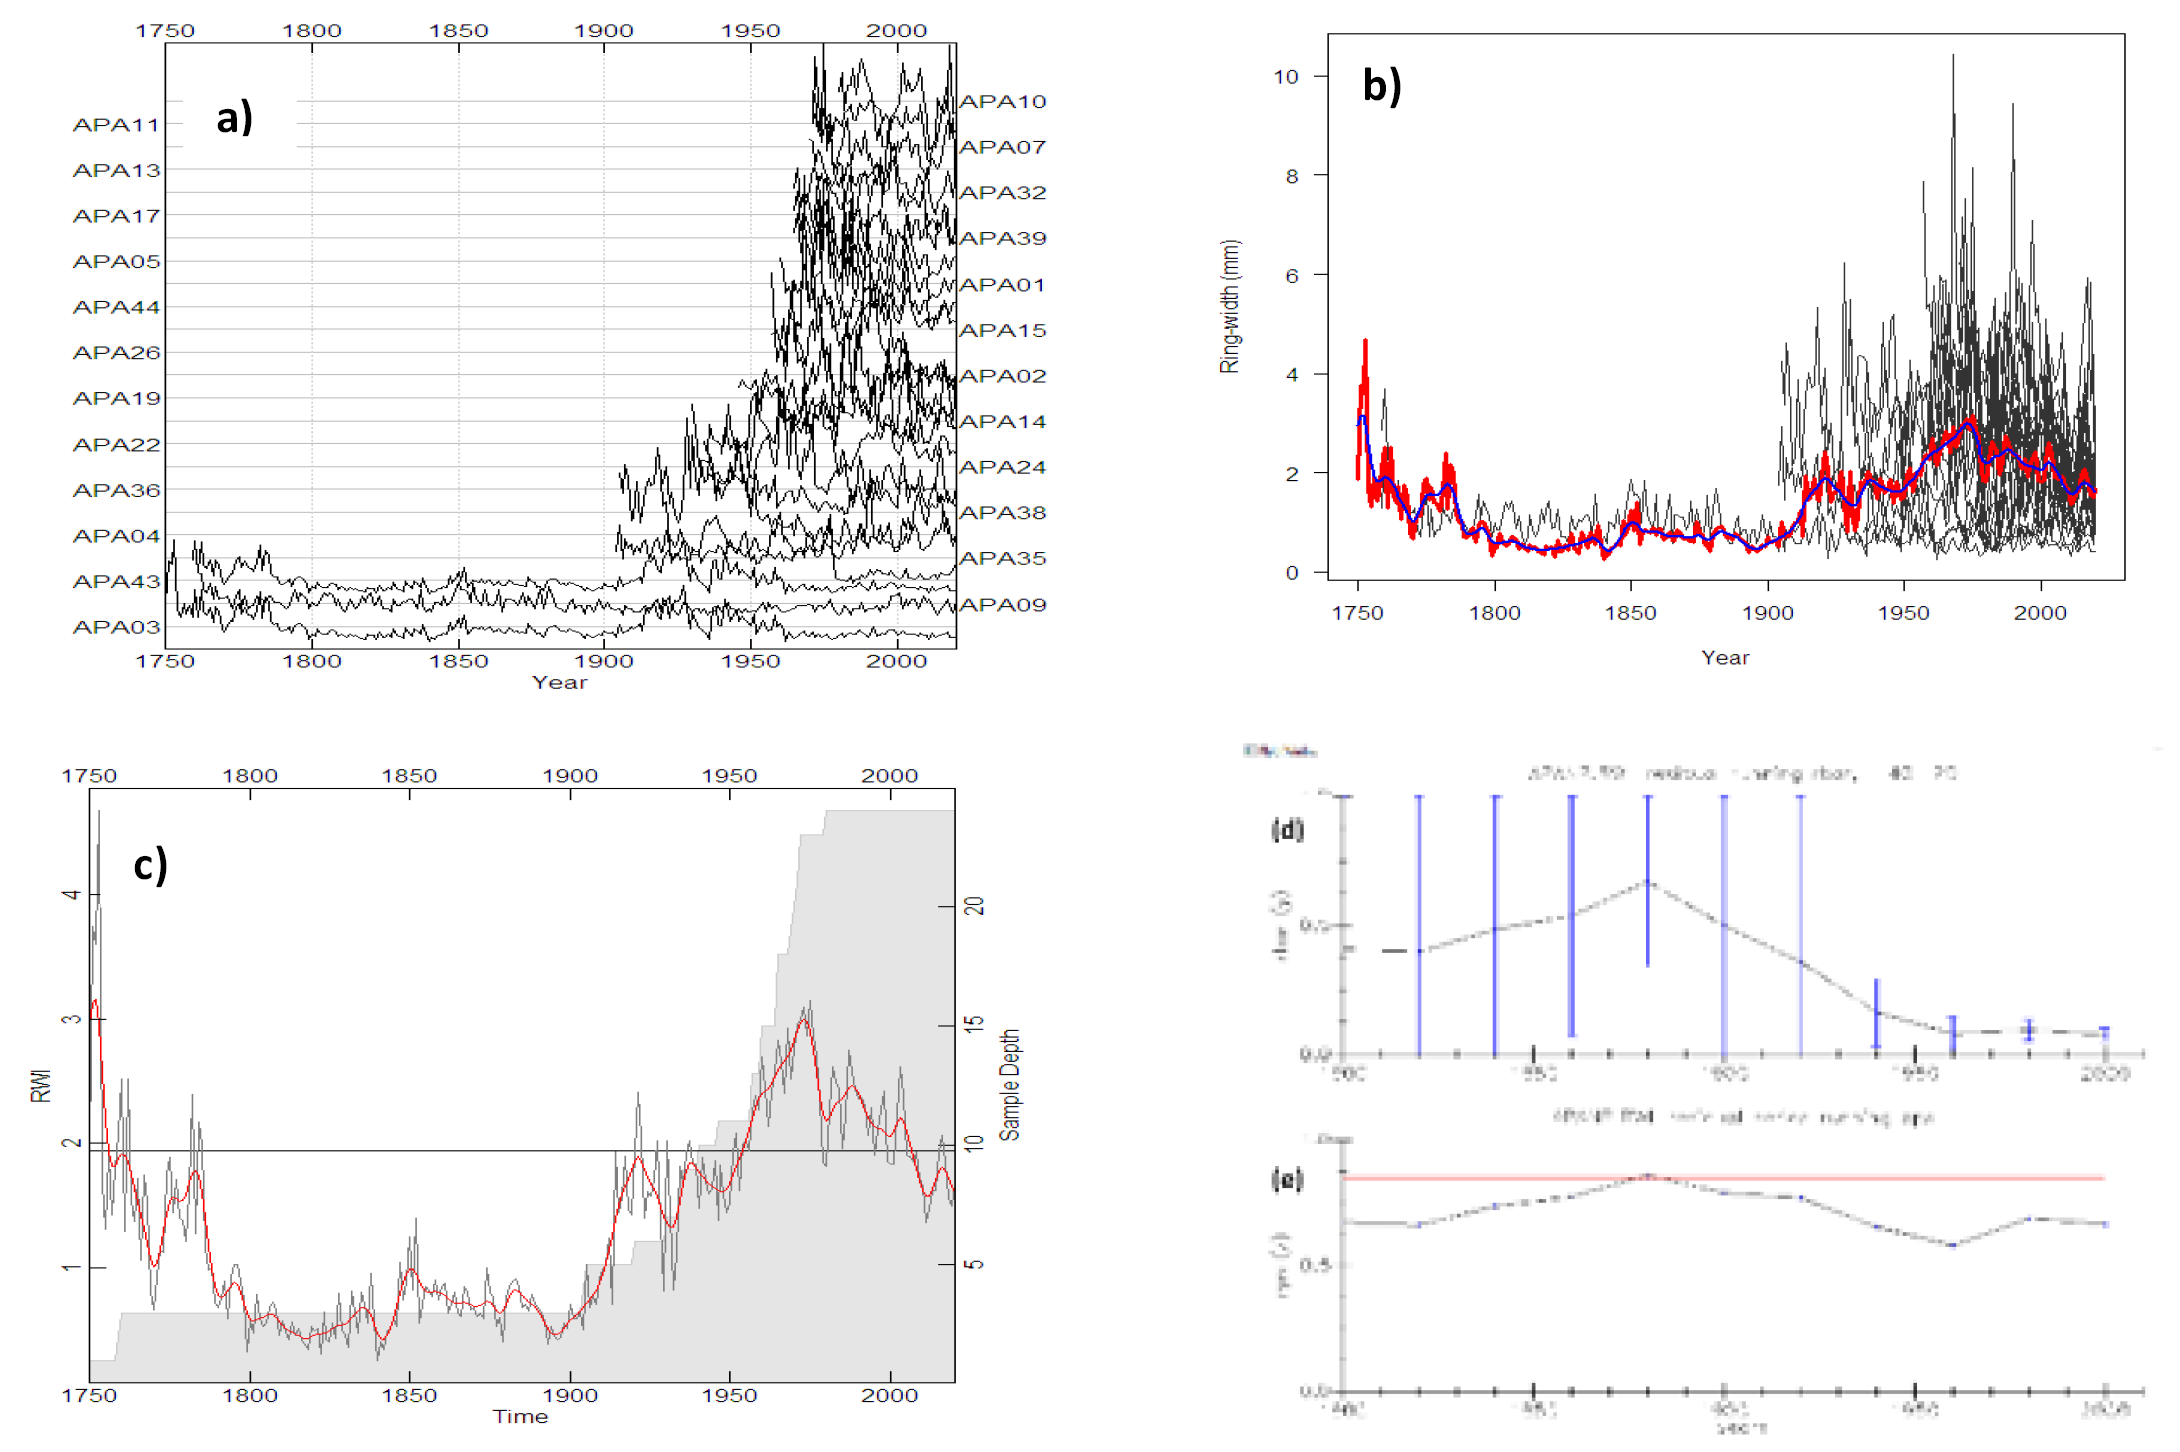
Figure 3:
(a) Spaghetti plots of all series (b) TRW measurement with mean (c) Chronology: horizontal black line shows mean growth; red line shows the spline; gray area shows the sample depth (d) Rbar (e) EPS: black line shows the running EPS and Rbar and horizontal red line shows accepted EPS threshold of ≥0.85 (Wigley et al., 1984).