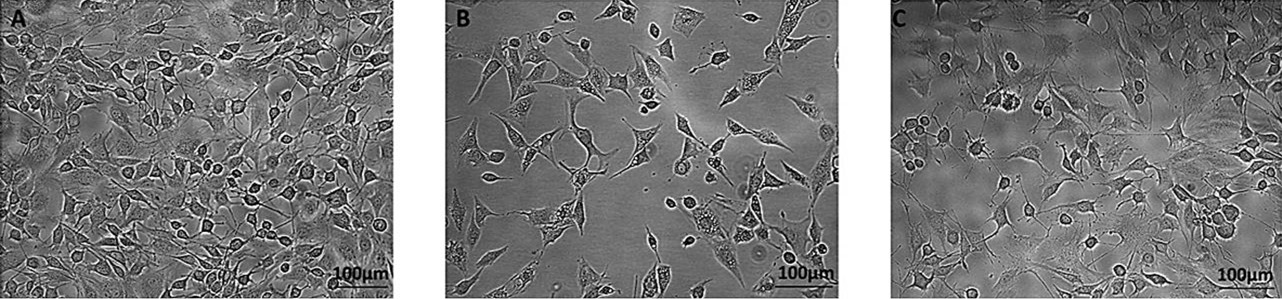
Fig. 2.
Inverted phase microscopy showing HepG2 cells control (A), Sorafenib (B) and combination (C) treated cells. The control cells (A) display normal morphology of HepG2 cells. In contrast, the cells treated with sorafenib (B) and combination (C) at their IC50 concentrations showed morphological alteration as compared to control. Images were taken at 10X magnification and scale bar is 100µm.