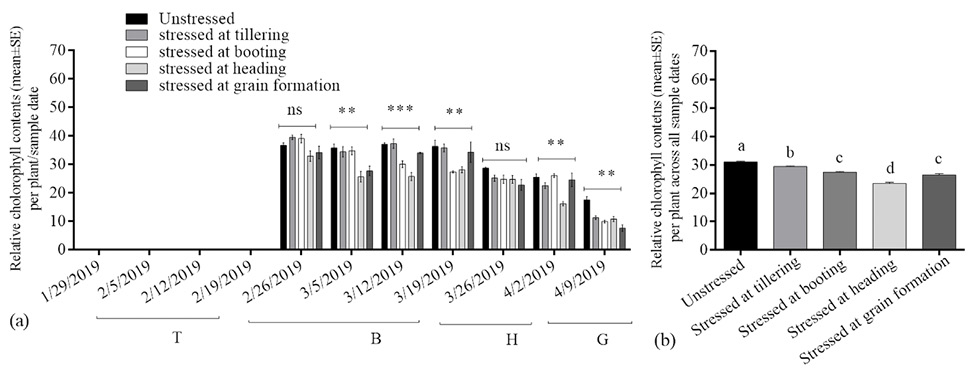
Fig. 3.
Mean chlorophyll contents per week (a); and their amount per season (b) per leaf from irrigation-stressed and unstressed wheat crop in the field at University farm in Multan, Pakistan, in 2019. Bars topped by the same letter are not significantly different (P˃0.05; LSD test). ns indicates non-significant difference. T: duration of tillering stage; B; duration of booting stage; H; duration of heading stage; G: duration of grain formation stage.
