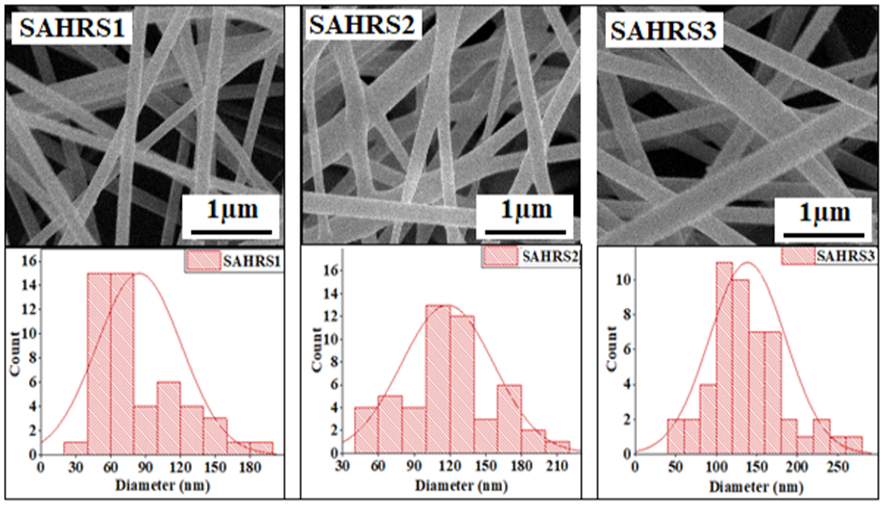
Figure 7:
SEM images (magnification level of 30x) of SAHRS1, SAHRS2, SAHRS3 nanofibers at 0.5, 1 and 1.5% concentrations and Diameter distribution.
SEM images (magnification level of 30x) of SAHRS1, SAHRS2, SAHRS3 nanofibers at 0.5, 1 and 1.5% concentrations and Diameter distribution.