
Fig. 3.
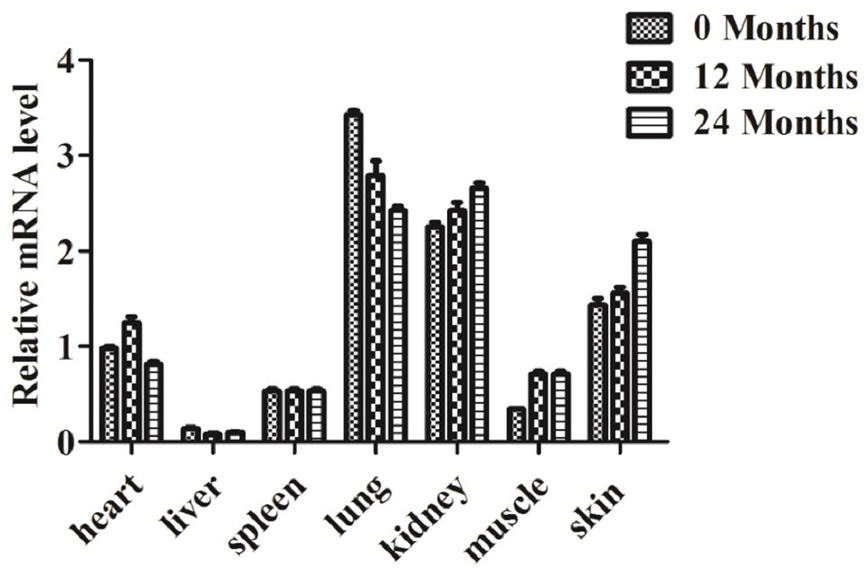
Relative mRNA expression profile of the KITL gene in different tissues of Youzhou dark goat. Quantitative data were represented as mean ± SD (n = 3).
Relative mRNA expression profile of the KITL gene in different tissues of Youzhou dark goat. Quantitative data were represented as mean ± SD (n = 3).