
Fig. 2.
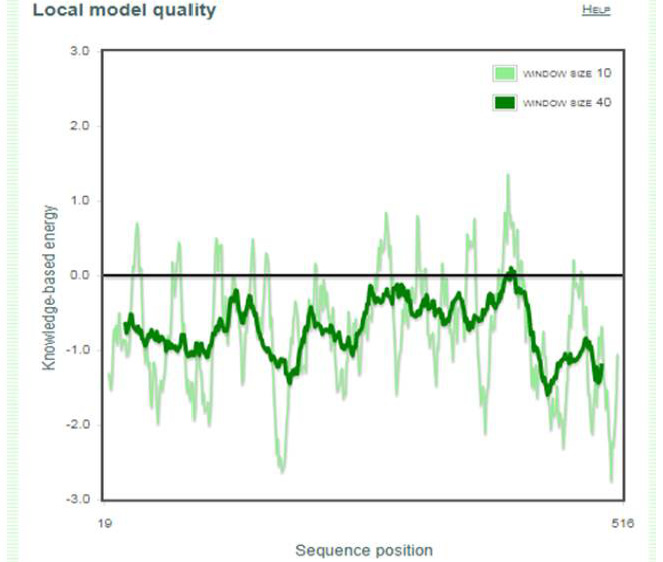
Graphical representation of the occurrence frequency of HA protein residues based on individual score (Y-axis) and residue position (X-axis).
Graphical representation of the occurrence frequency of HA protein residues based on individual score (Y-axis) and residue position (X-axis).