
Fig. 3.
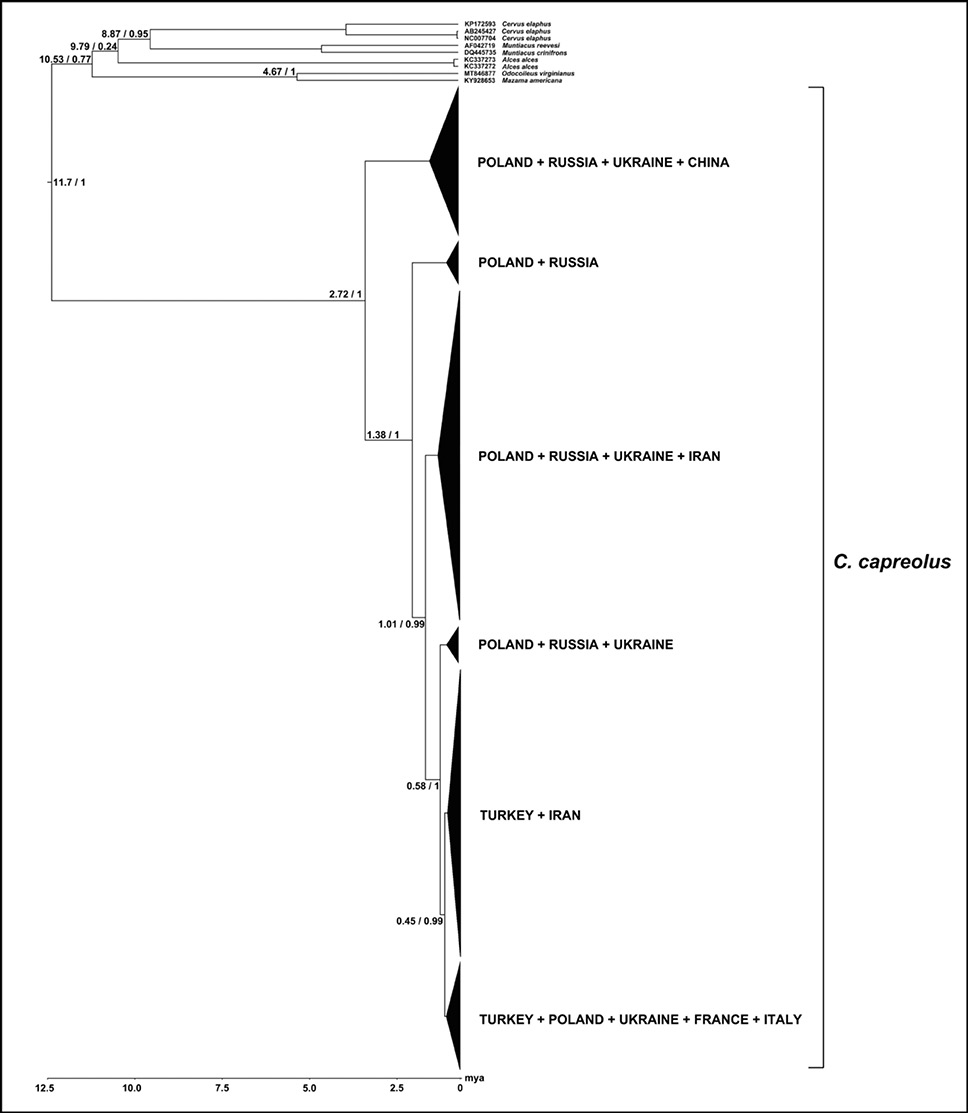
BI tree based on cyt b sequences showing evolutionary divergence within roe deer populations. Numbers on the nodes indicate divergence times (left) and Bayesian posterior probabilities (right).
BI tree based on cyt b sequences showing evolutionary divergence within roe deer populations. Numbers on the nodes indicate divergence times (left) and Bayesian posterior probabilities (right).