Figure 2:
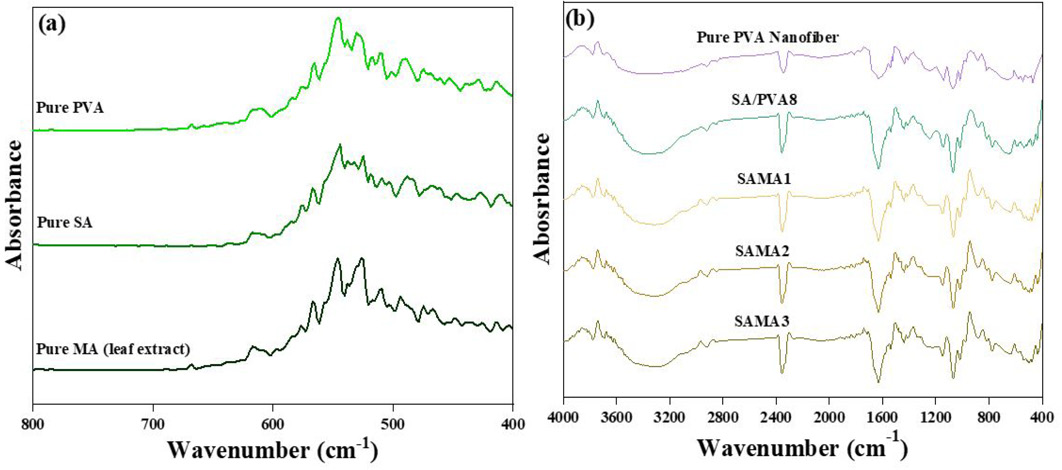
FTIR Spectrum of (a) pure PVA, SA and MA leaf extract, (b) pure PVA, SA/PVA8, SAMA1, SAMA2 and SAMA3 nanofibers at different concentrations.
FTIR Spectrum of (a) pure PVA, SA and MA leaf extract, (b) pure PVA, SA/PVA8, SAMA1, SAMA2 and SAMA3 nanofibers at different concentrations.