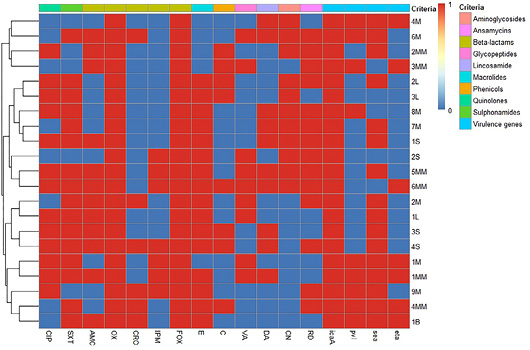
Heat map and hierarchical clustering of the tested Staphylococcus aureus isolates based on the occurrence of antimicrobial resistance, and virulence genes. In the heat map, red and blue colors represent the resistance/sensitivity to an antimicrobial agent and the presence/absence of a virulence gene. The code numbers on the left of the heat map and hierarchical clustering dendrogram represent the isolate code numbers for meat (M), luncheon (L), minced meat (MM), sausage (S), and burger (B) samples. CIP: ciprofloxacin, SXT: trimethoprim-sulfamethoxazole, AMC: amoxycillin-clavulanic acid, OX: oxacillin, CRO: ceftriaxone, IPM: imipenem, FOX: cefoxitin, E: erythromycin, C: chloramphenicol, VA: vancomycin, DA: clindamycin, CN: gentamicin, and RD: rifampin, icaA: intercellular adhesion A gene, pvl: Panton-Valentine leukocidin gene, sea: staphylococcal enterotoxin a gene and eta: exfoliative toxin a gene.