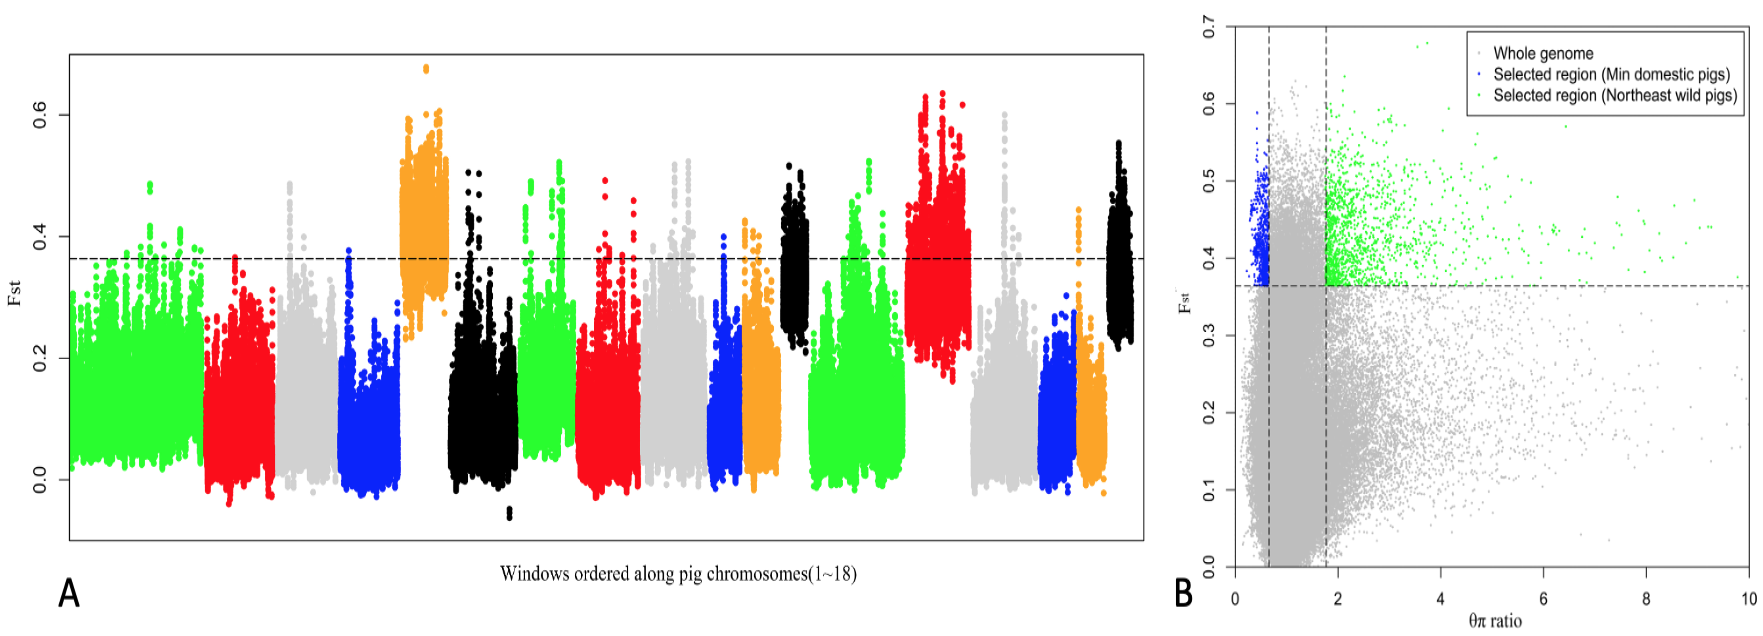
Fig. 4.
Selective sweeps in the Min pig and the Northeast wild boar. (A) θπ distribution across the pig chromosomes. (B) The ratio of Fst to θπ. The significant low and high θπ ratios of 0.728 and 1.367, and significantly high Fst values of 0.224 were used to screen the selected region of Min pig and Northeast wild boar. Blue points represent the selected region of Min pig, and green points represent the selected region of Northeast wild boar.