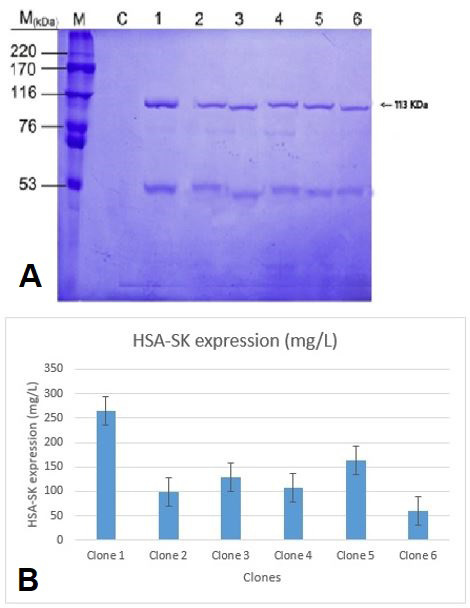
Fig. 3.
The expression analysis of six HSA-SK-pPICZαB transformant clones of P. pastoris GS115 using 10% SDS-PAGE. Lane M shows the protein marker, Lane C contain a control (P. pastoris GS115 strain transformed with a simple pPICZαB vector), and lanes 1-6 indicate HSA-SK-pPICZαB expression vector containing P. pastoris GS115 clones. The bands lie quite close to the expected HSA-SK value with clone 1 representing comparatively thicker band. B, A band intensity based estimation of HSA-SK fusion protein by analyzing the high definition image of SDS PAGE stained by CBB stain.P. pastoris clone 1 represented the highest expression level of HSA-SK gene i.e., more than 350mg/L.