View larger version:
Download Original File
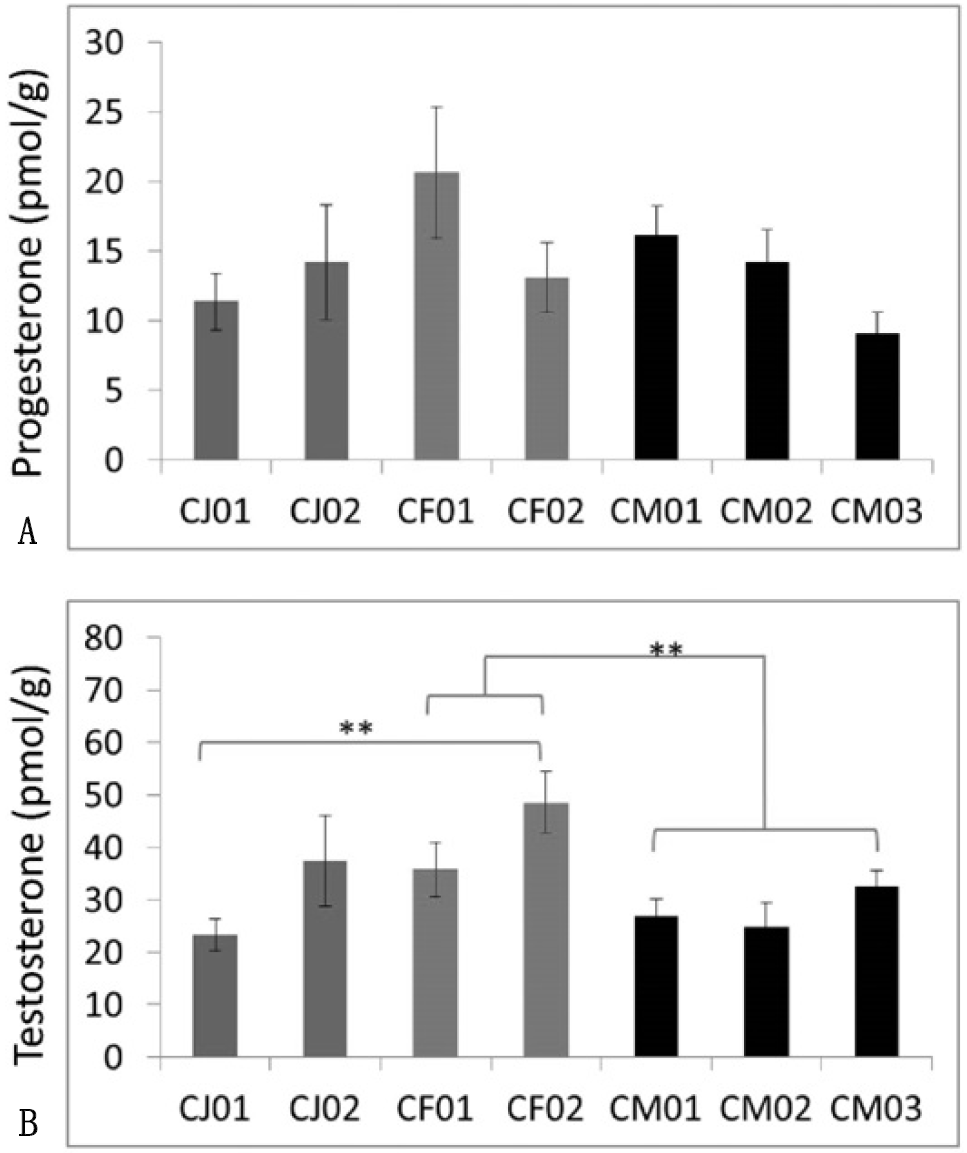
Fig. 3.
Comparison of progesterone (A) and testosterone (B) levels in the feces of group C members **0.001<P<0.01.