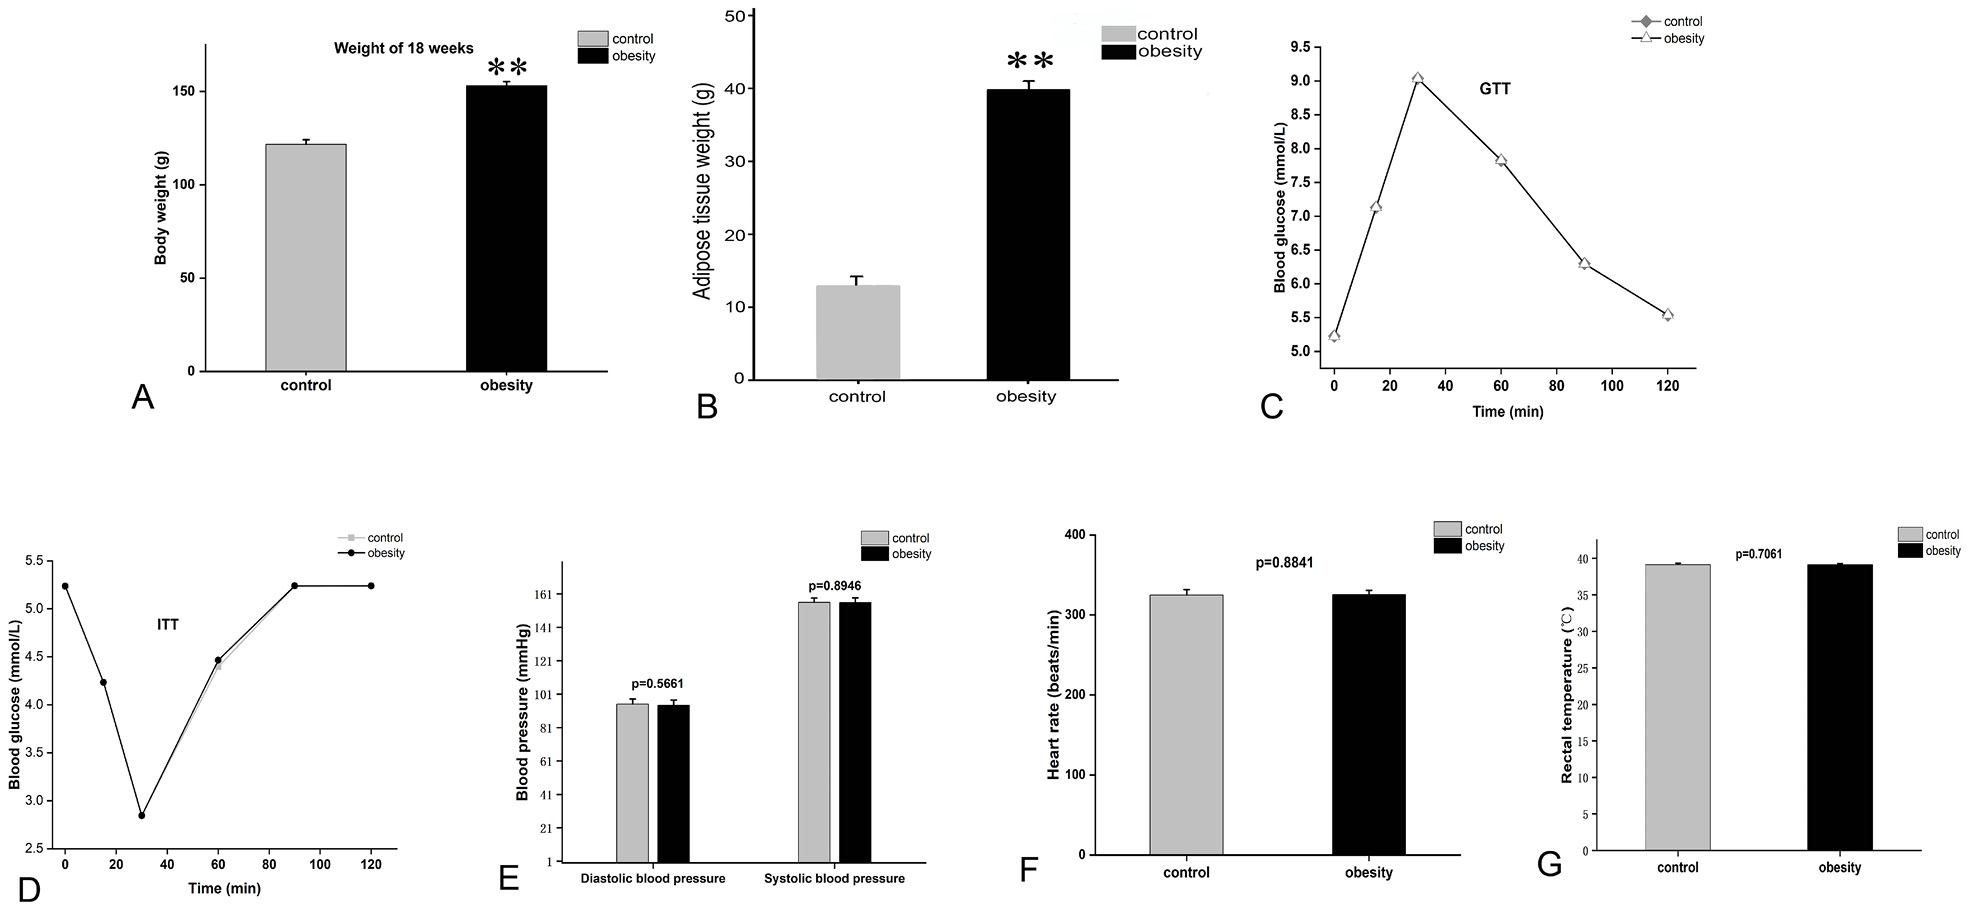
Fig. 1.
A, Body weight (BW) of control and obesity group T. belangeri in 18th week. B, Adipose tissue weight of control and obesity group T. belangeri in 18th week. C, Glycemic response during GTT. D, Glycemic response during ITT. E, Blood pressure of control and obesity group T. belangeri. F, Heart rate of control and obesity group T. belangeri. G, Rectal temperature of control and obesity group T. belangeri; N= 14 per group; statistical significance is indicated: *P < 0.05, **P < 0.01.
