View larger version:
Download Original File
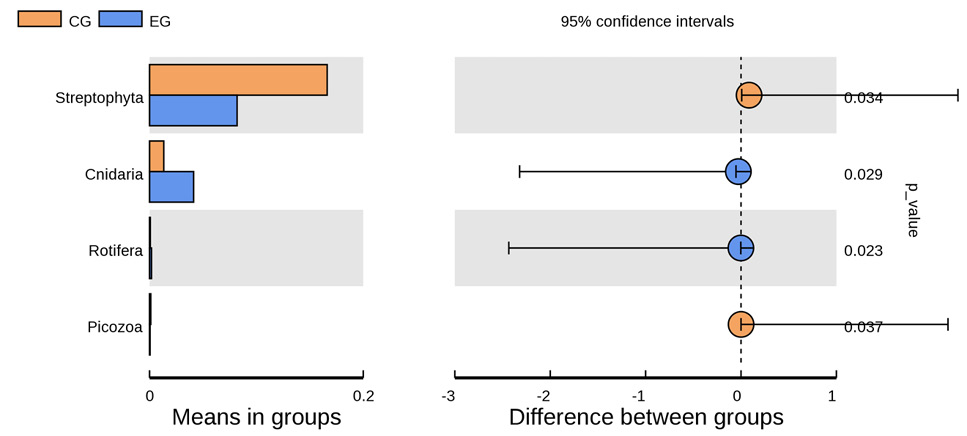
Fig. 4.
Significantly different phyla between groups based on t-test approach.
